
Candlestick charting is a type of financial chart used to analyze price movements in financial markets. It presents the open, high, low, and close of a particular period in the form of candlesticks, which visually represent the price data. Each candlestick represents a specific time period, and the patterns of these candlesticks over time can help traders identify trends and potential trading opportunities. Candlestick charting is believed to have originated in Japan in the 18th century and was used to track the prices of rice. Today, it is widely used by traders around the world to analyze price movements in a variety of financial markets, including stocks, bonds, currencies, and commodities. By identifying patterns and trends in candlestick charts, traders can make informed decisions about buying or selling assets. Candlestick charts consist of individual candlesticks that represent the price movement of a financial instrument within a specified time frame. Each candlestick has two main parts: the real body and the shadows. The real body represents the range between the opening and closing price, while the upper and lower shadows indicate the highest and lowest price points during the time frame. Candlesticks are color-coded to easily identify bullish and bearish price movements. Bullish candles, where the closing price is higher than the opening price, are typically green or white. Bearish candles, where the closing price is lower than the opening price, are usually red or black. Timeframes play a crucial role in candlestick charting, as they determine the period for each candlestick. Common timeframes include intraday (1-minute, 5-minute, 15-minute, and 1-hour), daily, and weekly or monthly charts. Candlestick patterns provide insights into market sentiment and can indicate potential price movements. These patterns are classified into single, two, and three-candlestick patterns. These patterns look very similar but have different implications depending on their context. A hammer occurs when the opening and closing prices are very close together, with a long lower wick and little or no upper wick. It suggests that sellers pushed the price down during the period, but buyers stepped in and pushed it back up, potentially indicating a bullish reversal. A hanging man is essentially the opposite of a hammer, occurring at the top of an upward trend and potentially signaling a bearish reversal. A doji occurs when the opening and closing prices are very close together, creating a very small body. It suggests indecision in the market and can potentially indicate a reversal. A long-legged doji has long upper and lower wicks, indicating even greater indecision. A marubozu has no wicks and a long body, indicating strong buying or selling pressure during the period. A white marubozu indicates a bullish trend, while a black marubozu indicates a bearish trend. An engulfing pattern occurs when the second candlestick "engulfs" the first, with a larger body in the opposite direction. A bullish engulfing pattern occurs when a small bearish candlestick is followed by a larger bullish one, potentially indicating a bullish reversal. A bearish engulfing pattern is the opposite, with a small bullish candlestick followed by a larger bearish one. These patterns occur when two candlesticks have identical or nearly identical highs or lows. Tweezer tops suggest a potential bearish reversal, while tweezer bottoms suggest a potential bullish reversal. A piercing pattern occurs when a bullish candlestick follows a bearish one, with the opening price of the bullish candlestick below the low of the previous period. It suggests a potential bullish reversal. A dark cloud cover is essentially the opposite, occurring when a bearish candlestick follows a bullish one, with the opening price of the bearish candlestick above the high of the previous period. These patterns occur over three days, with the first day being a long candlestick in the direction of the trend, followed by a small-bodied candlestick that gaps in the opposite direction, and finally a long candlestick in the direction of the trend. A morning star suggests a potential bullish reversal, while an evening star suggests a potential bearish reversal. Three white soldiers occur when three long bullish candlesticks follow a downtrend, potentially indicating a bullish reversal. Three black crows are the opposite, occurring when three long bearish candlesticks follow an uptrend, potentially indicating a bearish reversal. An abandoned baby occurs when a doji gaps away from the previous and following candlesticks, indicating a potential reversal. It suggests a period of indecision followed by a strong move in the opposite direction. Beyond basic patterns, advanced formations can help traders identify continuation or reversal signals. These patterns occur within a longer-term trend and suggest that the trend is likely to continue. A falling three methods occurs when a long bearish candlestick is followed by three smaller bullish candlesticks, and then another long bearish one. A rising three methods is the opposite, with a long bullish candlestick followed by three smaller bearish ones, and then another long bullish one. A window or gap occurs when there is a space between the high of one candlestick and the low of the next, indicating a sudden change in the market sentiment. A window that is left open suggests that the trend is likely to continue in the same direction. This pattern occurs over several candlesticks and suggests that a bullish trend may be coming to an end. It consists of a peak (the "head") with two smaller peaks on either side (the "shoulders"). The neckline is drawn by connecting the lows between the shoulders, and a break below the neckline indicates a potential bearish reversal. A double top occurs when the price reaches a peak, pulls back, and then returns to that same peak before dropping again. It suggests a potential bearish reversal. A double bottom is the opposite, occurring at the bottom of a downtrend and indicating a potential bullish reversal. These patterns occur when the highs and lows of candlesticks converge into a triangle or wedge shape. A symmetrical triangle suggests indecision in the market, while an ascending triangle indicates a potential bullish reversal and a descending triangle indicates a potential bearish reversal. A rising wedge indicates a bearish reversal, while a falling wedge indicates a bullish reversal. Candlestick charting can be applied to various trading strategies, such as swing trading, day trading, and position trading. Proper risk management and psychological discipline are essential for successful trading. Different trading strategies utilize candlestick charting to identify entry and exit points based on market sentiment and price action. Swing trading involves holding positions for several days to weeks, capitalizing on price swings. Candlestick patterns can help identify potential trend reversals or continuations, providing valuable entry and exit signals. Day trading requires buying and selling financial instruments within a single trading day. Candlestick patterns on intraday timeframes can help day traders recognize short-term trends and potential breakouts or reversals. Position trading is a long-term strategy where traders hold positions for weeks to months. Candlestick charting on higher timeframes, such as weekly and monthly charts, can provide insights into the overall market direction and significant turning points. Effective risk management is critical for successful trading. By using stop-loss orders and proper position sizing, traders can limit their losses and protect their capital. Stop-loss orders automatically close a position when the price reaches a predetermined level, preventing further losses. Traders can set stop-loss orders based on candlestick patterns or technical analysis levels. Position sizing involves determining the number of shares or contracts to trade based on the trader's account size and risk tolerance. Proper position sizing ensures that traders do not risk too much of their capital on a single trade. Easy to read: Candlestick charts provide a visual representation of price movement, making it easy to see trends, reversals, and key levels of support and resistance. Provides useful information: Candlestick charts can provide information such as opening and closing prices, high and low prices, and the overall trend for a given time period. This information can help traders make informed decisions about when to buy or sell. Works with other technical indicators: Candlestick charting can be used in conjunction with other technical analysis tools to provide a more complete picture of market trends and potential trade opportunities. Can be used for any timeframe: Candlestick charts can be used to analyze any timeframe, from minutes to months, making them useful for both short-term and long-term trading. Subjective interpretation: The interpretation of candlestick patterns is not always clear-cut and can be subjective, leading to different traders interpreting the same pattern in different ways. Limited to price data: Candlestick charts only show price data, which can be limiting for traders who want to incorporate other types of data into their analysis, such as volume or news events. Can be noisy: Candlestick charts can be noisy and difficult to read in very volatile markets, making it harder to identify trends and key levels of support and resistance. Not always reliable: Like any technical analysis tool, candlestick charting is not always reliable and can provide false signals, leading traders to make poor trading decisions. It is important to use candlestick patterns in conjunction with other analysis techniques to confirm potential trade opportunities. Trading psychology plays a significant role in success, as emotions can influence decision-making. Maintaining discipline and consistency is crucial for long-term profitability. Controlling emotions, such as fear and greed, is essential for making objective trading decisions. Traders should have a clear plan and stick to it, avoiding impulsive decisions based on emotions. Successful traders remain disciplined and consistent in their approach, following their trading plan and risk management rules regardless of short-term outcomes. Candlestick charting is a vital tool in modern finance, providing valuable insights into market sentiment and potential price movements. By combining candlestick charting with other technical analysis tools and maintaining proper risk management and psychological discipline, traders can improve their decision-making and increase their chances of success in the financial markets. Continuous learning and adaptation are crucial for staying ahead in the ever-evolving world of trading.What Is Candlestick Charting?
Components of a Candlestick Chart
Candlestick Anatomy
Color Coding of Candlesticks
Timeframes in Candlestick Charting
Basic Candlestick Patterns
Single Candlestick Patterns
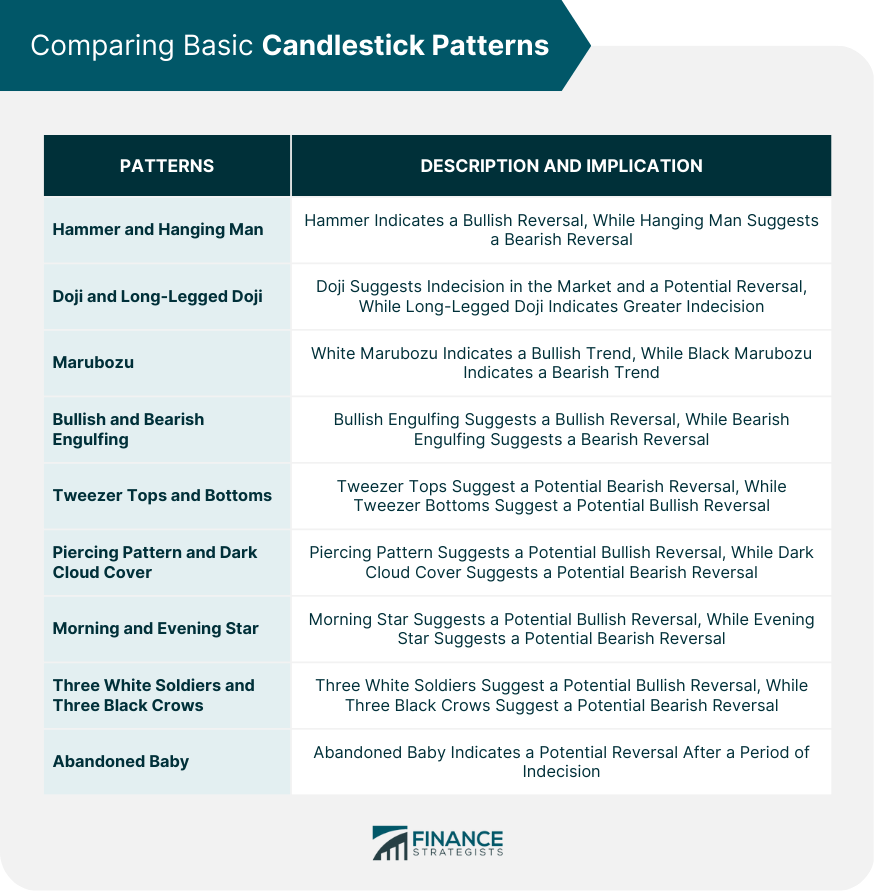
Hammer and Hanging Man
Doji and Long-Legged Doji
Marubozu
Two-Candlestick Patterns
Bullish and Bearish Engulfing
Tweezer Tops and Bottoms
Piercing Pattern and Dark Cloud Cover
Three-Candlestick Patterns
Morning and Evening Star
Three White Soldiers and Three Black Crows
Abandoned Baby
Advanced Candlestick Patterns and Formations
Continuation Patterns
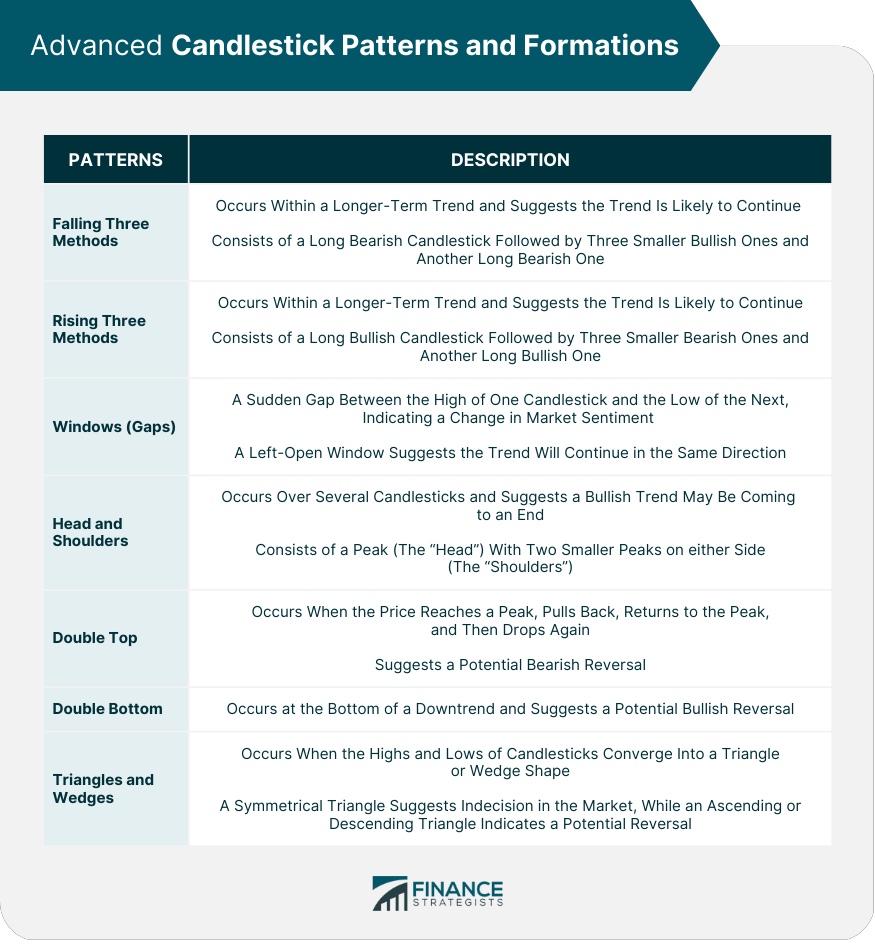
Falling and Rising Three Methods
Windows
Reversal Patterns
Head and Shoulders
Double Top and Double Bottom
Triangles and Wedges
Practical Application of Candlestick Charting
Trading Strategies
Swing Trading
Day Trading
Position Trading
Risk Management
Stop-Loss Orders
Position Sizing
Benefits and Drawbacks of Candlestick Charting
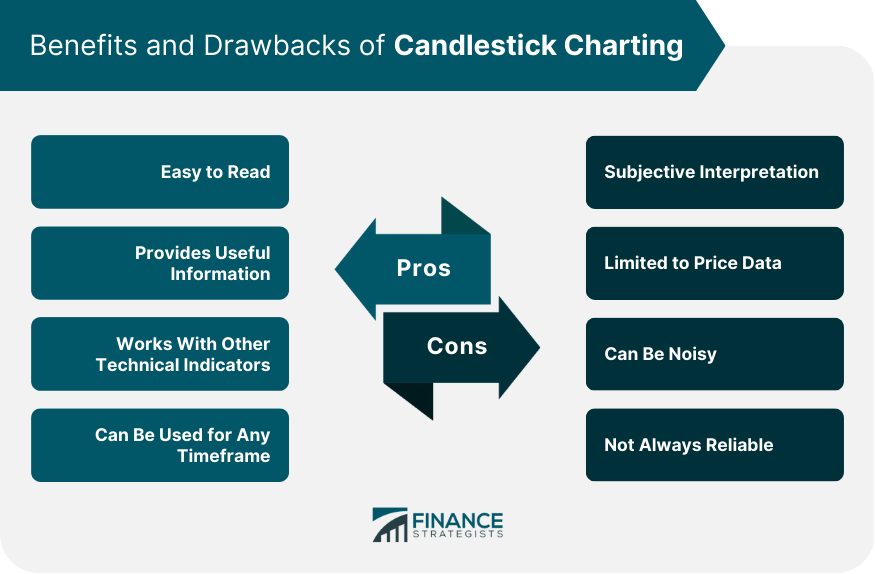
Pros
Cons
Psychological Aspects of Trading
Emotion Management
Discipline and Consistency
Conclusion
Candlestick Charting FAQs
Candlestick charting is a type of financial chart used by traders to analyze price movements in financial markets. It is a visual representation of price data that shows the open, high, low, and close of a particular period in the form of candlesticks.
Each candlestick on a chart represents a specific time period (e.g., a day, a week, an hour). The body of the candlestick represents the opening and closing prices of that period, while the upper and lower "wicks" (or "shadows") represent the highest and lowest prices reached during that period. By looking at the patterns of these candlesticks over time, traders can identify trends and potential trading opportunities.
There are many different candlestick chart patterns that traders look for, including "doji" (where the opening and closing prices are very close together), "hammer" (a bullish reversal pattern), and "shooting star" (a bearish reversal pattern). These patterns can help traders predict potential price movements.
Candlestick charting provides a visual representation of price data that can be easier to interpret than other types of financial charts. It also allows traders to identify trends and patterns more quickly, which can lead to more profitable trading decisions.
Candlestick charting is just one tool among many that traders can use to analyze financial markets. It should not be used in isolation, and traders should always consider other factors (such as economic indicators, news events, and market sentiment) when making trading decisions. Additionally, candlestick patterns are not always accurate predictors of price movements, and traders should be cautious not to rely too heavily on them.
True Tamplin is a published author, public speaker, CEO of UpDigital, and founder of Finance Strategists.
True is a Certified Educator in Personal Finance (CEPF®), author of The Handy Financial Ratios Guide, a member of the Society for Advancing Business Editing and Writing, contributes to his financial education site, Finance Strategists, and has spoken to various financial communities such as the CFA Institute, as well as university students like his Alma mater, Biola University, where he received a bachelor of science in business and data analytics.
To learn more about True, visit his personal website or view his author profiles on Amazon, Nasdaq and Forbes.


