
In the world of technical analysis, Outside Days are a specific type of price pattern that have particular implications for market trends. By definition, an Outside Day is a two-day price pattern in which the range of the second day (its high to its low) completely engulfs the range of the first day. In other words, the second day's high is higher than the first day's high, and its low is lower than the first day's low. This pattern is notable because it represents an intensification of trading activity and can signal a potential reversal or continuation of the current trend. Outside Days act as an important signal, providing valuable insights into potential market movements. When used in conjunction with other technical indicators, Outside Days can help traders anticipate potential price reversals or trend continuations, informing trading strategies and decision-making processes. The terms 'high' and 'low' refer to the highest and lowest trading prices within a given day. An Outside Day forms when the day's high surpasses the previous day's high and its low falls below the previous day's low. This complete engulfing of the previous day's price range indicates a significant shift in market sentiment and often precedes notable price movements. The significance of an Outside Day depends greatly on the previous day's range. If the previous day had a narrow range—indicating limited trading activity—an Outside Day may suggest that traders have become more active and the trend could change. Conversely, if the previous day had a wide range, the Outside Day might simply signify continued volatility. Trading volume plays a crucial role in validating an Outside Day. High trading volume on the Outside Day strengthens the pattern's reliability as a potential trend-reversal indicator. Low trading volume, however, may cast doubt on the significance of the pattern, suggesting it may be a random price fluctuation rather than an impending trend shift. Outside Days are considered crucial indicators of potential trend shifts. They can imply a strong buying or selling pressure that may lead to a trend reversal. A bullish Outside Day, where the close is higher than the open, may suggest buying pressure and a potential upward trend. On the other hand, a bearish Outside Day, where the close is lower than the open, could indicate selling pressure and a possible downward trend. The heightened trading activity associated with Outside Days can often precede significant price movements. When an Outside Day occurs after a prolonged price trend, it can signal a potential trend reversal. For instance, a bullish Outside Day following a lengthy downtrend may indicate that the trend is about to reverse, offering a buying opportunity for traders. Understanding the variations between bullish and bearish Outside Days is vital in predicting future price movements. A bullish Outside Day signifies a potential reversal of a downward trend, while a bearish Outside Day might signal an impending reversal of an upward trend. Identifying these patterns can provide traders with valuable insight into potential trading opportunities. In technical analysis, Outside Days are incorporated into a wide range of chart patterns to enhance the accuracy of trend predictions. For example, they can be a part of reversal patterns like the Double Top or Bottom and continuation patterns like the Ascending Triangle or Descending Triangle. Recognizing an Outside Day within these chart patterns can offer additional confirmation of the anticipated trend. Candlestick charts offer a visual way to identify Outside Days. These charts represent the open, high, low, and close of a given trading period and make it easy to spot a day where the high and low are both outside the previous day's range. Given their importance in signaling potential price reversals, identifying Outside Days on a candlestick chart can be a powerful tool for traders. The significance of an Outside Day can vary depending on the time frame being analyzed. On a daily chart, an Outside Day might indicate a short-term trend reversal. However, on a weekly or monthly chart, Outside Days could suggest more significant, long-term trend changes. Traders often use multiple time frames to validate the implications of an Outside Day. In the application of Outside Days to trading strategies, risk and reward considerations are crucial. While Outside Days can provide potential entry or exit signals, they should be used in conjunction with stop-loss orders to manage risk effectively. If the anticipated trend reversal doesn't materialize, a stop-loss order can limit potential losses. Outside Days can be particularly effective when combined with other technical indicators. For instance, combining an Outside Day with indicators such as moving averages or the relative strength index (RSI) can provide additional confirmation of a potential trend reversal. This multi-indicator approach can help traders increase the accuracy of their predictions and make more informed trading decisions. Consider a scenario where a trader identifies a bullish Outside Day after a significant downtrend in a stock's price. The high volume on this day, coupled with the confirmation from an upward crossing of the moving averages, could provide a strong buy signal. On the other hand, a bearish Outside Day might occur at the top of a prolonged uptrend, with the stock price closing lower than it opened despite reaching a new high during the day. If this pattern is accompanied by high trading volume and other bearish indicators, it could suggest a sell signal. Outside Days represent a significant shift in trading activity that may precede changes in market direction. As such, they can help traders identify potential opportunities to enter or exit trades. When used in conjunction with other technical analysis tools, such as moving averages or the relative strength index (RSI), Outside Days can provide additional confirmation of potential trend reversals or continuations. This can enhance the accuracy of market analysis and trading decisions. By providing early signals of potential trend changes, Outside Days can help traders manage risk more effectively. For example, a trader could set a stop-loss order based on the signal from an Outside Day, potentially limiting losses if the anticipated trend reversal doesn't materialize. Outside Days can be effective over different timeframes, from intraday to daily to weekly charts. This flexibility allows traders to adapt their strategies to different trading styles and objectives. Outside Days can be identified in a variety of markets, including equities, forex, commodities, and futures. This wide applicability can make Outside Days a valuable tool for a diverse range of traders and investors. Due to market volatility, Outside Days can sometimes occur frequently, leading to potential misinterpretation and erroneous trading decisions. This risk is especially pronounced in highly volatile markets. The reliability of Outside Days is often tied to the trading volume on the day they occur. If an Outside Day occurs on low volume, it may be less reliable as a signal of a trend reversal. This means traders need to monitor not just price action, but also volume data, which may not always be readily available or accurate. Outside Days usually need confirmation from subsequent trading activity or other technical indicators to be reliable. This means that traders can't make decisions based solely on the occurrence of an Outside Day. They need to wait for additional evidence, which could lead to missed opportunities. While simple, interpreting Outside Days can be complicated, especially for novice traders. Context is vital when interpreting Outside Days, and understanding the broader market conditions, the asset's recent trend, and the nature of the Outside Day (whether bullish or bearish) requires a fair amount of expertise. For less liquid assets, Outside Days may be less predictive because of the potential for price manipulation or random price fluctuations. Thus, while Outside Days can be helpful across a range of markets, they might be less reliable for certain assets. Outside Days are a two-day price pattern in technical analysis where the range of the second day completely engulfs the range of the first day. They represent an intensification of trading activity and can signal a potential reversal or continuation of the current trend. When used in conjunction with other technical indicators, they can help traders anticipate price reversals or trend continuations, thereby informing trading strategies and decision-making processes. Outside Days are particularly useful when incorporated into chart patterns and candlestick charts, offering additional confirmation of anticipated trends. However, it is important to consider the limitations of Outside Days, such as the risk of false signals, the reliance on trading volume, the need for confirmation from subsequent trading activity, the complexity of interpretation, and their limitations with illiquid assets. Traders should exercise caution and supplement their analysis with other tools to mitigate these limitations and enhance the accuracy of their predictions.What Are Outside Days?
Mechanics of Outside Days
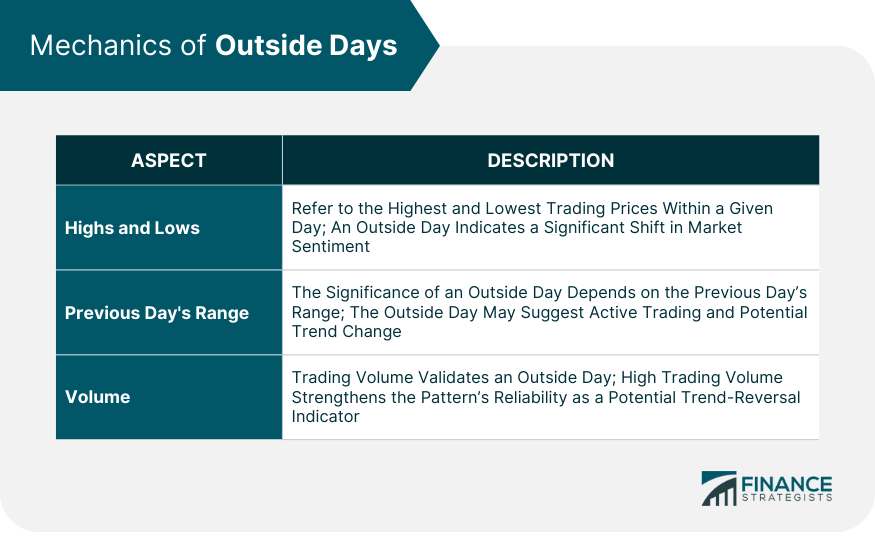
Highs and Lows
Previous Day's Range
Volume
Interpretation of Outside Days
Implications for Trends
Outside Days as a Signal for Potential Reversal
Variations: Bullish vs Bearish Outside Days
Outside Days in Technical Analysis
Incorporation Into Chart Patterns
Use in Candlestick Charts
Interpretation Within Various Time Frames
Using Outside Days in Trading Strategies
Risk and Reward Considerations
Combining With Other Technical Indicators
Hypothetical Examples
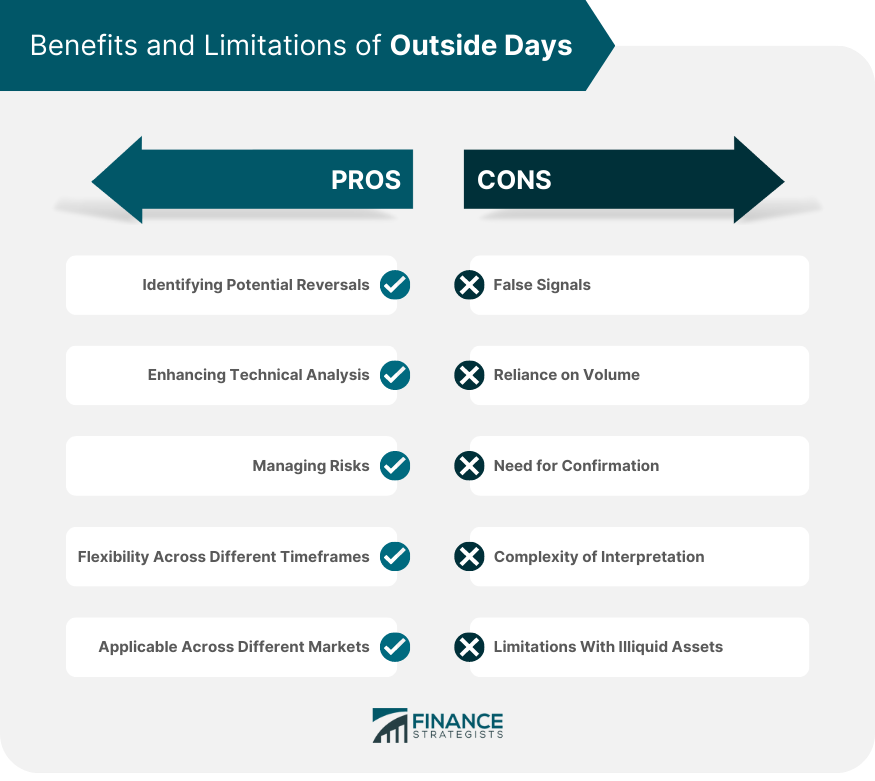
Benefits of Outside Days
Identifying Potential Reversals
Enhancing Technical Analysis
Managing Risks
Flexibility Across Different Timeframes
Applicable Across Different Markets
Limitations of Outside Days
False Signals
Reliance on Volume
Need for Confirmation
Complexity of Interpretation
Limitations With Illiquid Assets
Final Thoughts
Outside Days FAQs
An Outside Day can be identified when the high of the second day is higher than the high of the first day, and the low of the second day is lower than the low of the first day, completely engulfing its range.
If an Outside Day follows a narrow range day, it suggests that traders have become more active, indicating a potential change in trend as compared to the limited trading activity of the previous day.
Outside Days can provide valuable insights into potential trend reversals, but they should be used in conjunction with other technical indicators and confirmation from subsequent trading activity for more reliable signals.
Outside Days can be incorporated into trading strategies by combining them with other technical indicators such as moving averages or the relative strength index (RSI) to increase the accuracy of predictions and inform trading decisions.
Yes, Outside Days can be identified and applied in various markets, including equities, forex, commodities, and futures, and they can be effective across different timeframes, from intraday to daily to weekly charts, offering flexibility to adapt to different trading styles and objectives.
True Tamplin is a published author, public speaker, CEO of UpDigital, and founder of Finance Strategists.
True is a Certified Educator in Personal Finance (CEPF®), author of The Handy Financial Ratios Guide, a member of the Society for Advancing Business Editing and Writing, contributes to his financial education site, Finance Strategists, and has spoken to various financial communities such as the CFA Institute, as well as university students like his Alma mater, Biola University, where he received a bachelor of science in business and data analytics.
To learn more about True, visit his personal website or view his author profiles on Amazon, Nasdaq and Forbes.


