
The Hikkake Pattern, pronounced "hi-ka-keh," is a chart formation used in technical analysis to spot potential market reversals or continuation breakouts. Introduced by Daniel L. Chesler in 2003, this Japanese-named pattern, meaning "hook, ensnare, trap," often misleads traders into false positions due to its deceptive setup involving a series of candlestick bars. Developed in response to the early 21st century's volatile financial markets, it has since been widely adopted for its simplicity and effectiveness. The Hikkake Pattern offers actionable information, enabling traders to strategically enter or exit positions. Easy to identify on a price chart, it suits traders of various experience levels and can be applied across different markets and time frames, making it a versatile tool in financial trading. The first component of the Hikkake pattern is the setup bar. This bar sets the initial range of the pattern by establishing a certain high and low price level. These are the highest and lowest price points achieved during this period, respectively. Traders carefully observe these levels as they act as potential resistance (the high) and support (the low) zones. A setup bar could be of any shape and size, and it doesn't necessarily have to indicate any particular trend. It essentially sets the context within which the Hikkake pattern can develop. The second bar of the pattern, known as the inside bar, is crucial for the development of the Hikkake pattern. It forms within the range of the setup bar, which means it has a lower high and a higher low than the setup bar. This characteristic forms an 'inside day,' indicating a contraction in volatility. Traders interpret this as a period of indecision in the market, where neither the buyers nor the sellers are able to take full control. Inside bars are typically associated with consolidations, during which market participants wait for more information before committing to a direction. The final component of the Hikkake pattern is the confirmation bar. This is where the pattern earns its reputation for "trapping" traders. Initially, the confirmation bar seems to break out beyond the high or low of the setup bar, luring traders to believe in a potential trend in that direction. However, it then reverses direction and makes a significant move in the opposite direction, effectively trapping those who acted on the false breakout. This break-and-reversal action forms the main characteristic of the Hikkake pattern and signals the potential start of a new trend. It is called the "Hikkake" because the term translates to "hook" or "trap" in Japanese. In trading, the Hikkake Pattern is a valuable technical analysis tool utilized to forecast potential price reversals or continuations. It works on the principle of false breakouts and price entrapment, making it highly effective in volatile markets. This pattern is seen as a bullish signal, indicating the possibility of an upcoming upward price movement. Here's how it works: After the formation of the setup bar and inside bar, the price initially breaks below the low of the inside bar, suggesting a potential downward trend. However, this is where the "trap" is set. Instead of continuing down, the price reverses and closes above the high of the inside bar. This false breakout and sudden reversal can catch sellers off-guard, leaving them trapped in their positions. With this bear trap sprung, buying pressure tends to increase, potentially driving the price upwards. Traders looking for bullish opportunities may enter a long position when this pattern is observed. On the flip side, a bearish Hikkake pattern indicates a potential downward price movement. Similar to the bullish pattern, after the setup bar and inside the bar, the price initially breaks above the high of the inside bar, luring buyers into believing an upward trend is imminent. However, the price then reverses, closing below the low of the inside bar, effectively trapping the buyers who thought they were riding an upward breakout. As the bullish traders scramble to exit their positions, selling pressure increases, potentially leading to a downward price movement. Traders who are looking for bearish opportunities may enter a short position when this pattern is recognized. For the Hikkake pattern to be considered valid, certain conditions need to be met. Firstly, an inside bar must follow the setup bar. Secondly, the confirmation bar should initially break the high or low of the inside bar before reversing and breaking out in the opposite direction. The breakout of the confirmation bar is a crucial factor in validating the Hikkake pattern. In identifying a Hikkake pattern, traders must look out for the distinctive three-bar formation. Volume can also be a valuable indicator, often increasing during the formation of the pattern and notably at the point of breakout. Furthermore, other technical analysis tools, such as trend lines, resistance and support levels, and momentum oscillators, can be used to reinforce the pattern's validity. Confirmation is crucial in the Hikkake pattern. The false breakout of the confirmation bar is the key 'trap' element of the Hikkake pattern. If the confirmation bar does not exhibit this reversal behavior, then the pattern is invalid. Confirmation can also come from other technical analysis tools. For instance, a resistance level coinciding with the false breakout level could offer additional confirmation. To trade with the Hikkake pattern, first, identify the pattern on the chart, ensuring all conditions are met. For a bullish pattern, the trade entry point would be as the price breaks above the high of the inside bar. For a bearish pattern, the trade entry is as the price breaks below the low of the inside bar. Stop-loss orders are crucial for managing risk. In a bullish Hikkake pattern, place the stop-loss order slightly below the low of the confirmation bar. Conversely, in a bearish pattern, position it just above the high of the confirmation bar. This strategy limits potential losses if the market moves contrary to the expected direction. Profit targets with the Hikkake pattern often involve a risk-reward ratio. A popular strategy is aiming for a 2:1 risk-reward ratio, meaning the potential profit is twice the risk taken on the trade. This target can be adjusted based on the trader's risk tolerance and market volatility. Risk management is vital in any trading strategy, including using the Hikkake pattern. One must consider the position size, stop-loss orders, and potential profit targets. Moreover, be aware of upcoming market news or data releases that could cause unexpected price movements and distort the pattern. One of the key advantages of the Hikkake pattern is its simplicity. The pattern is relatively straightforward to identify on a price chart, even for those new to technical analysis. The three-bar setup - the setup bar, the inside bar, and the confirmation bar - can be spotted without needing complex calculations or advanced charting tools. The Hikkake pattern is versatile and can be applied across a variety of markets - from forex and commodities to equities and indices. It is also not confined to a specific timeframe and can be used in intraday trading, swing trading, and even long-term investment analysis. The Hikkake pattern provides traders with clearly defined entry and exit points. This is particularly beneficial for trade management, as it can aid in setting stop-loss and take-profit levels, thereby helping to control risk and potential returns. The pattern’s defining characteristic is the false breakout, which often traps other traders into believing a price move will continue in the direction of the breakout. By understanding the Hikkake pattern, traders can exploit these false breakouts, giving them an edge over traders who get trapped. Despite its many advantages, the Hikkake pattern, like any trading pattern, is not without its limitations. There can be instances where the pattern leads to false signals, suggesting a price reversal or continuation that doesn't materialize. This can result in potential losses for the trader. The Hikkake pattern’s effectiveness can vary under different market conditions. For instance, in a highly trending market, false breakouts may be less likely, making the pattern less reliable. It’s generally not advisable to rely solely on the Hikkake pattern for trading decisions. As with most technical analysis tools, it’s best used in conjunction with other indicators to confirm signals and increase the likelihood of successful trades. This might involve using volume indicators, momentum oscillators, or other patterns to validate the signal generated by the Hikkake pattern. While similar to other patterns, like the Inside Bar pattern, the Hikkake pattern includes a false breakout, adding an extra layer of complexity and potential profitability. Unlike more complex patterns, such as the Elliott Wave pattern, the Hikkake pattern is simpler and easier to identify. Choosing when to use the Hikkake pattern depends on several factors, including the trader's strategy, the market conditions, and the asset being traded. As the Hikkake pattern is designed to spot reversals and continuations, it's particularly useful in volatile markets. For greater accuracy, the Hikkake pattern can be combined with other trading tools, such as moving averages, RSI, or Fibonacci retracement levels. Such tools can offer additional confirmation for the pattern, enhancing its reliability and profitability. The Hikkake Pattern is a technical trading instrument that assists in spotting potential market reversals or breakouts. It consists of a setup bar, an inside bar, and a confirmation bar, signaling an initial breakout in one direction before reversing to trap traders. Noted for its simplicity and versatility across various markets and timeframes, the Hikkake Pattern also provides clearly defined entry and exit points. Nonetheless, it may produce false signals, and its effectiveness can vary under different volatility levels. Implementing the Hikkake Pattern, combined with a well-rounded approach to wealth management involving fundamental analysis, portfolio diversification, and risk management, can provide a significant trading advantage. It's crucial to seek advice from financial experts when dealing with advanced strategies and wealth management services. Remember, continual learning fuels trading success.What Is the Hikkake Pattern?
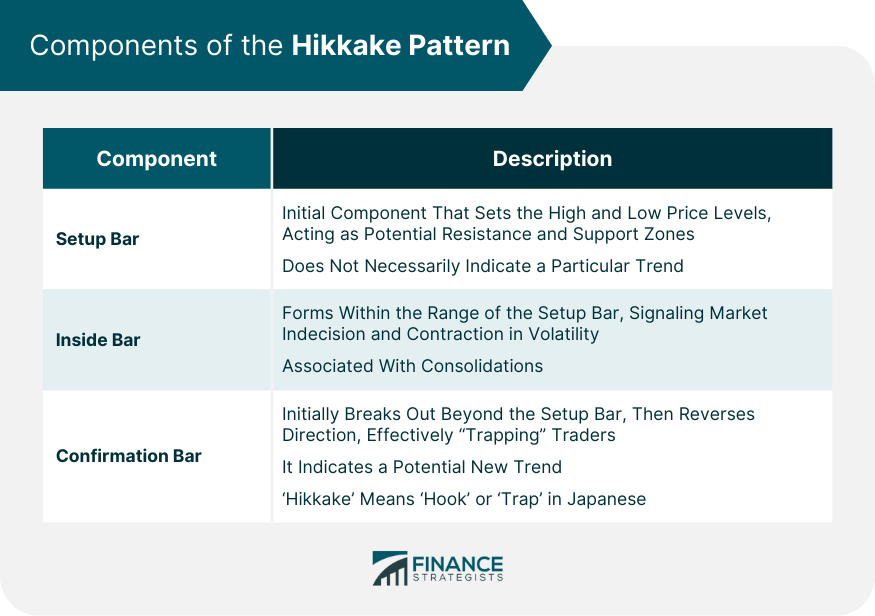
Components of the Hikkake Pattern
Setup Bar
Inside Bar
Confirmation Bar
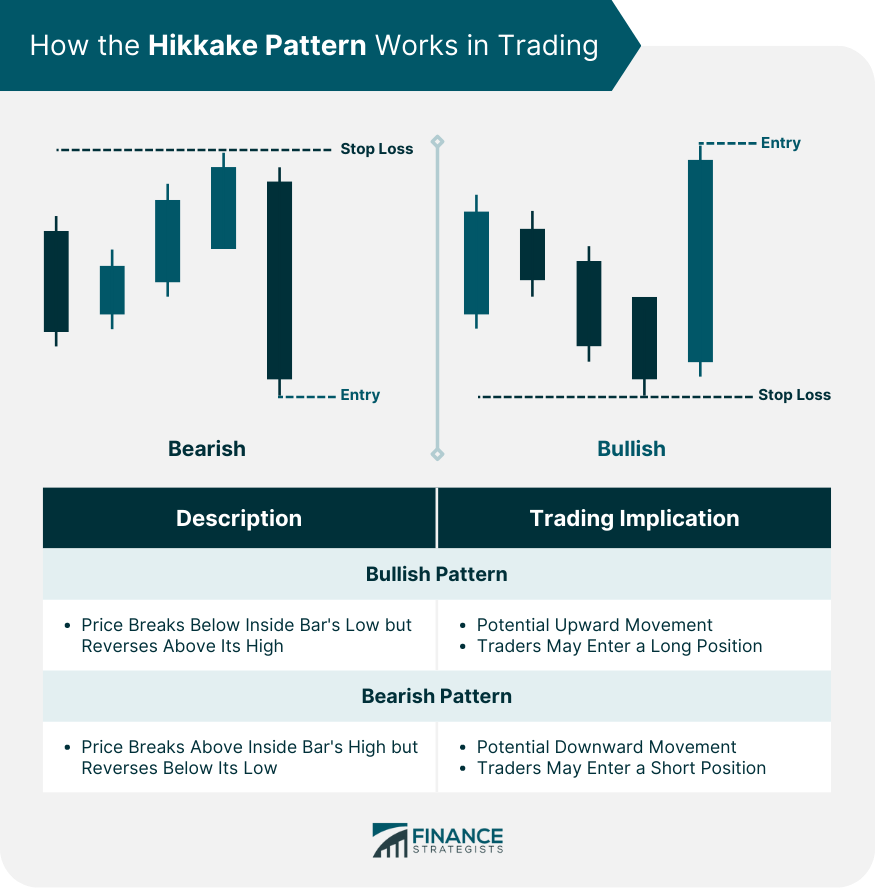
How the Hikkake Pattern Works in Trading
Bullish Hikkake Pattern
Bearish Hikkake Pattern
Identifying the Hikkake Pattern
Conditions for a Valid Hikkake Pattern
Key Indicators of the Hikkake Pattern
Role of Confirmation in the Hikkake Pattern
Trading Strategies Using the Hikkake Pattern
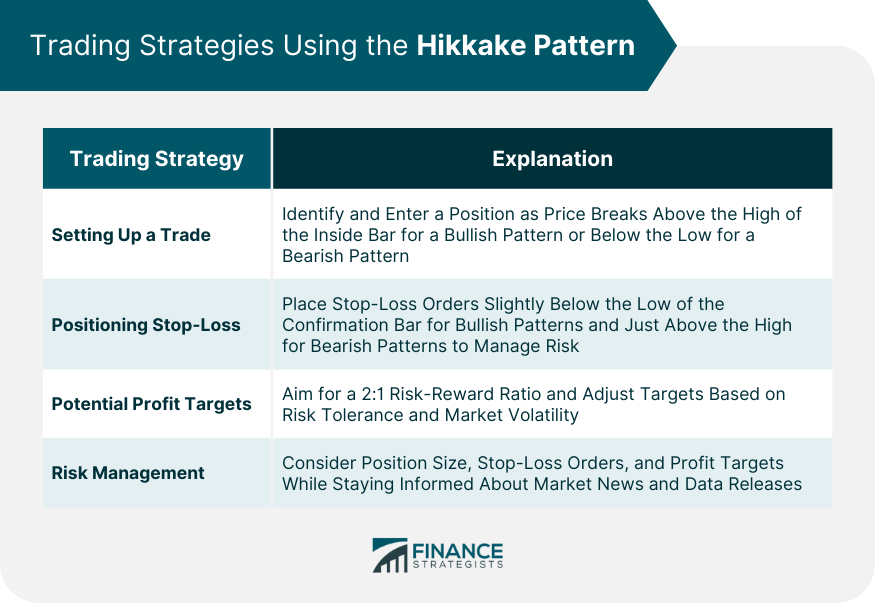
Setting Up a Trade
Positioning Stop-Loss
Potential Profit Targets
Risk Management
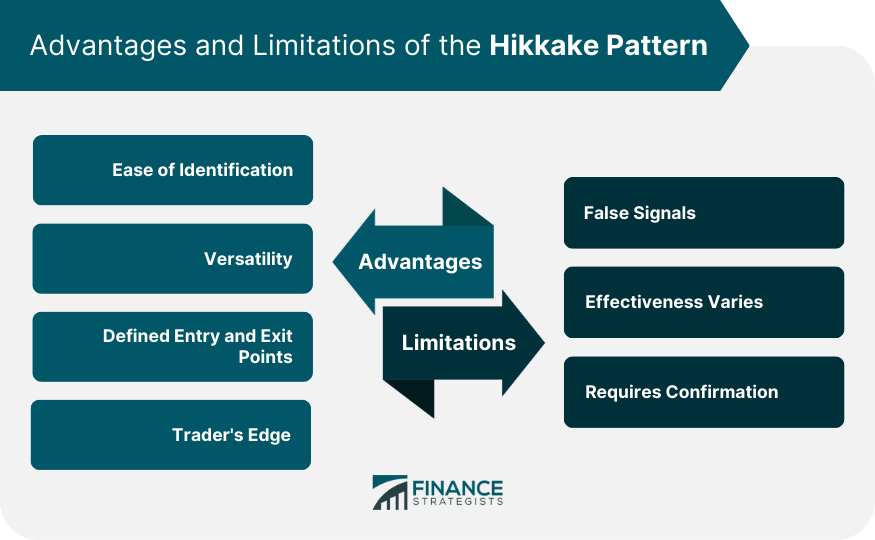
Advantages of the Hikkake Pattern
Ease of Identification
Versatility
Defined Entry and Exit Points
Trader's Edge
Limitations of the Hikkake Pattern
False Signals
Effectiveness Varies
Requires Confirmation
Hikkake Pattern in the Context of Other Trading Patterns
Final Thoughts
Hikkake Pattern FAQs
The Hikkake Pattern is a three-bar price pattern used in technical analysis to identify potential market reversals or continuation breakouts.
The Hikkake Pattern is identified by a setup bar, followed by an inside bar, and then a confirmation bar that initially breaks the inside bar's high or low before reversing.
Yes, the Hikkake Pattern is versatile and can be used across different markets, including stocks, forex, commodities, and indices.
The Hikkake Pattern, like any trading pattern, can sometimes give false signals, and the anticipated price move may not always occur. Its effectiveness can also vary in different market conditions.
The Hikkake Pattern can work in various market conditions, but its effectiveness may increase during volatile periods due to larger price movements.
True Tamplin is a published author, public speaker, CEO of UpDigital, and founder of Finance Strategists.
True is a Certified Educator in Personal Finance (CEPF®), author of The Handy Financial Ratios Guide, a member of the Society for Advancing Business Editing and Writing, contributes to his financial education site, Finance Strategists, and has spoken to various financial communities such as the CFA Institute, as well as university students like his Alma mater, Biola University, where he received a bachelor of science in business and data analytics.
To learn more about True, visit his personal website or view his author profiles on Amazon, Nasdaq and Forbes.


