
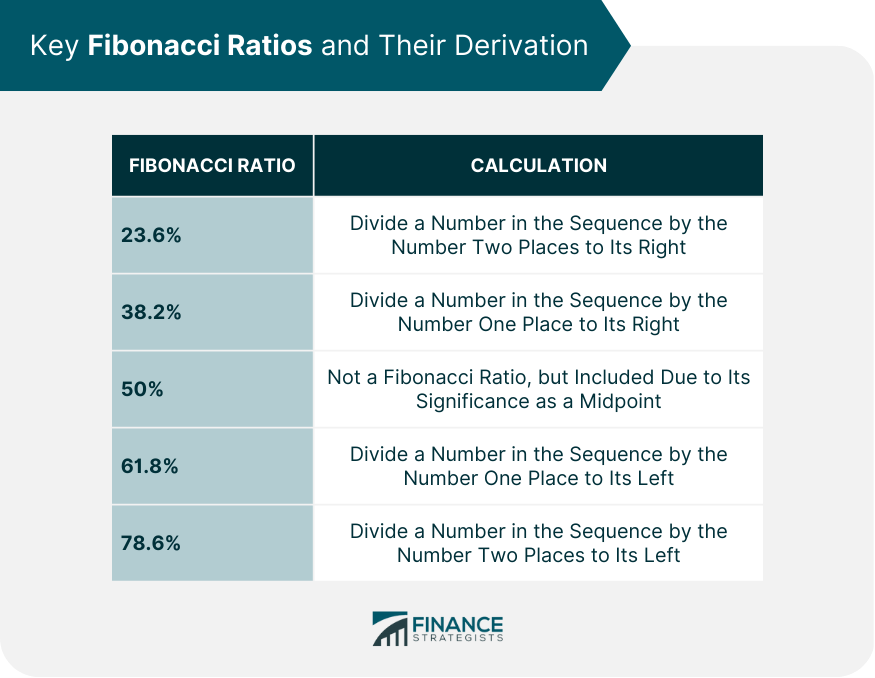
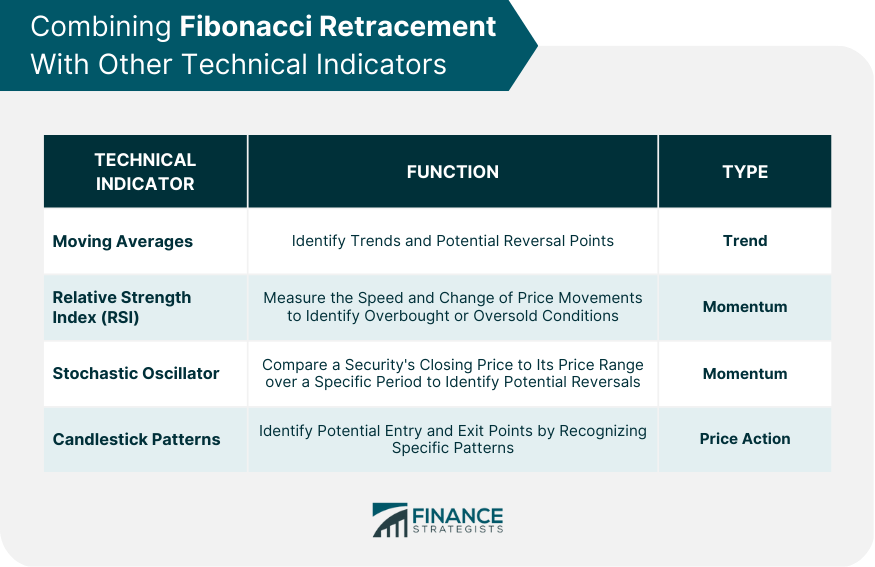
Fibonacci retracement is a technical analysis tool used to identify potential levels of support and resistance in a market trend. It is based on the idea that markets will often retrace a predictable portion of a move, after which they will continue to move in the original direction. The key levels used in Fibonacci retracement are 23.6%, 38.2%, 50%, 61.8%, and 100%. Traders use these levels to identify potential buying or selling opportunities when a market trend retraces to one of these levels. Fibonacci retracement can be used in any market that exhibits trending behavior, including stocks, forex, and commodities. The Fibonacci sequence is a series of numbers in which each number is the sum of the two preceding ones, starting from 0 and 1. The sequence goes as follows: 0, 1, 1, 2, 3, 5, 8, 13, 21, 34, and so on. This sequence has unique properties, and the ratios between the numbers exhibit patterns that can be observed in various natural phenomena. Fibonacci retracement is based on a set of key Fibonacci ratios, which are derived from the Fibonacci sequence. These ratios are: 23.6%: This ratio is derived by dividing a number in the sequence by the number two places to its right. 38.2%: Obtained by dividing a number in the sequence by the number one place to its right. 50%: Although not a Fibonacci ratio, this level is often included due to its significance in Dow Theory and as a midpoint. 61.8%: Derived by dividing a number in the sequence by the number one place to its left. 78.6%: This ratio is derived by dividing a number in the sequence by the number two places to its left. The golden ratio, approximately 1.618, is a mathematical constant derived from the Fibonacci sequence. It is obtained by dividing a number in the sequence by the number immediately preceding it. The golden ratio is considered significant in Fibonacci retracement as the inverse of this ratio (0.618 or 61.8%) is a crucial retracement level. Fibonacci retracement can be applied to both uptrends and downtrends in financial markets. In an uptrend, traders use the tool to identify potential support levels, while in a downtrend, they use it to identify potential resistance levels. The timeframe selection is crucial when applying Fibonacci retracement. Traders can use the tool on various timeframes, including intraday, daily, weekly, and monthly charts. However, it is essential to choose a timeframe that aligns with the trader's overall trading strategy and risk tolerance. To draw Fibonacci retracement levels, traders plot the key Fibonacci ratios on a chart to create potential support and resistance zones. These zones, also known as confluence zones, are areas where multiple Fibonacci levels overlap, increasing their significance. Fibonacci retracement can help traders identify buying and selling signals in the market. When the price approaches a Fibonacci retracement level, traders may consider entering or exiting positions based on the anticipated reversal or continuation of the trend. It is also essential to set appropriate stop-loss and take-profit levels to manage risk. To enhance the effectiveness of Fibonacci retracement, traders often combine it with other technical indicators, such as: Moving Averages: These indicators help identify trends and potential reversal points in the market. Relative Strength Index (RSI): RSI is a momentum indicator that measures the speed and change of price movements, helping traders identify overbought or oversold conditions. Stochastic Oscillator: This momentum indicator compares a security's closing price to its price range over a specific period, assisting traders in identifying potential reversals. Candlestick Patterns: Traders use various candlestick patterns to identify potential entry and exit points, enhancing the effectiveness of Fibonacci retracement levels. By combining Fibonacci retracement with these indicators, traders can develop more robust trading strategies that improve their chances of success. There are numerous trading strategies that incorporate Fibonacci retracement levels, including: Trend Continuation: Traders can use Fibonacci retracement levels to enter trades in the direction of the prevailing trend, targeting higher probability confluence zones. Trend Reversal: When combined with other technical indicators or chart patterns, traders can use Fibonacci retracement levels to identify potential trend reversals, entering trades when the market shows signs of changing direction. Breakout Trading: Traders can utilize Fibonacci retracement levels to identify potential breakout points in the market, entering trades when price action breaks through key support or resistance zones. One limitation of using Fibonacci retracement is the subjectivity involved in drawing retracement levels. Traders may interpret chart patterns differently, leading to inconsistencies in the placement of Fibonacci levels. Fibonacci retracement levels, like any other technical indicator, can produce false signals. The presence of market noise can sometimes lead traders to make incorrect decisions based on these levels. As with any trading strategy, it is crucial to practice proper risk management when using Fibonacci retracement levels. Traders should set stop-loss orders and take-profit targets to protect themselves from adverse market movements. Fibonacci retracement is a valuable tool in a trader's toolbox, offering insights into potential support and resistance levels in financial markets. By combining Fibonacci retracement with other technical indicators and adhering to sound risk management practices, traders can develop robust trading strategies to increase their chances of success. However, it is essential to remain aware of the limitations and risks associated with using Fibonacci retracement in trading. Consult a financial advisor for further information on how Fibonacci retracement can help achieve goals and objectives in trading.What Is Fibonacci Retracement?
Fibonacci Sequence and Ratios
The Fibonacci Sequence Explained
Key Fibonacci Ratios and Their Derivation
The Golden Ratio and Its Significance in Fibonacci Retracement
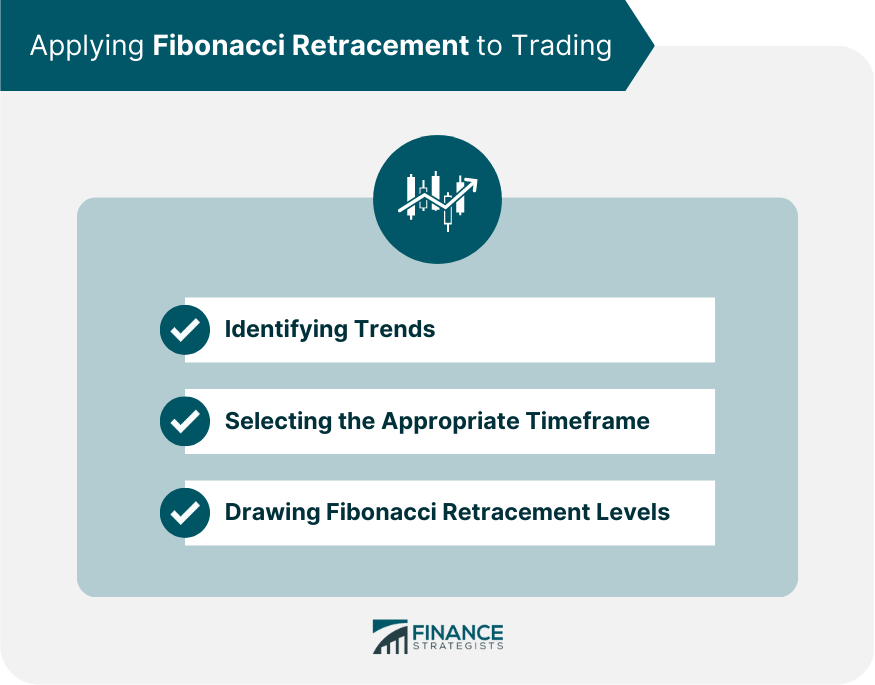
Applying Fibonacci Retracement to Trading
Identifying Trends
Selecting the Appropriate Timeframe
Drawing Fibonacci Retracement Levels
Fibonacci Retracement Strategies
Entry and Exit Points
Combining Fibonacci Retracement With Other Technical Indicators
Examples of Successful Fibonacci Retracement Trading Strategies
Limitations and Risks of Fibonacci Retracement
Subjectivity in Drawing Retracement Levels
False Signals and Market Noise
Importance of Risk Management
Conclusion
Fibonacci Retracement FAQs
Fibonacci retracement is a technical analysis tool that is used to identify potential levels of support and resistance in a market trend. It is based on the idea that markets will often retrace a predictable portion of a move, after which they will continue to move in the original direction.
Fibonacci retracement levels are based on a sequence of numbers known as the Fibonacci sequence. The key levels are 23.6%, 38.2%, 50%, 61.8%, and 100%. Traders use these levels to identify potential levels of support and resistance. When a market trend retraces to one of these levels, it is often viewed as a potential buying or selling opportunity.
Fibonacci retracement can be used in any market that exhibits trending behavior, including stocks, forex, and commodities. Traders often use Fibonacci retracement in conjunction with other technical analysis tools to confirm potential levels of support and resistance.
Fibonacci retracement is not a perfect tool and should not be relied on exclusively for making trading decisions. However, it is a widely used tool that has proven to be effective in identifying potential levels of support and resistance. Traders should use Fibonacci retracement in conjunction with other technical analysis tools and fundamental analysis to make informed trading decisions.
Yes, Fibonacci retracement can be used in combination with other technical analysis tools such as trend lines, moving averages, and momentum indicators. Traders often use multiple tools to confirm potential levels of support and resistance and to gain a better understanding of the overall market trend.
True Tamplin is a published author, public speaker, CEO of UpDigital, and founder of Finance Strategists.
True is a Certified Educator in Personal Finance (CEPF®), author of The Handy Financial Ratios Guide, a member of the Society for Advancing Business Editing and Writing, contributes to his financial education site, Finance Strategists, and has spoken to various financial communities such as the CFA Institute, as well as university students like his Alma mater, Biola University, where he received a bachelor of science in business and data analytics.
To learn more about True, visit his personal website or view his author profiles on Amazon, Nasdaq and Forbes.


