
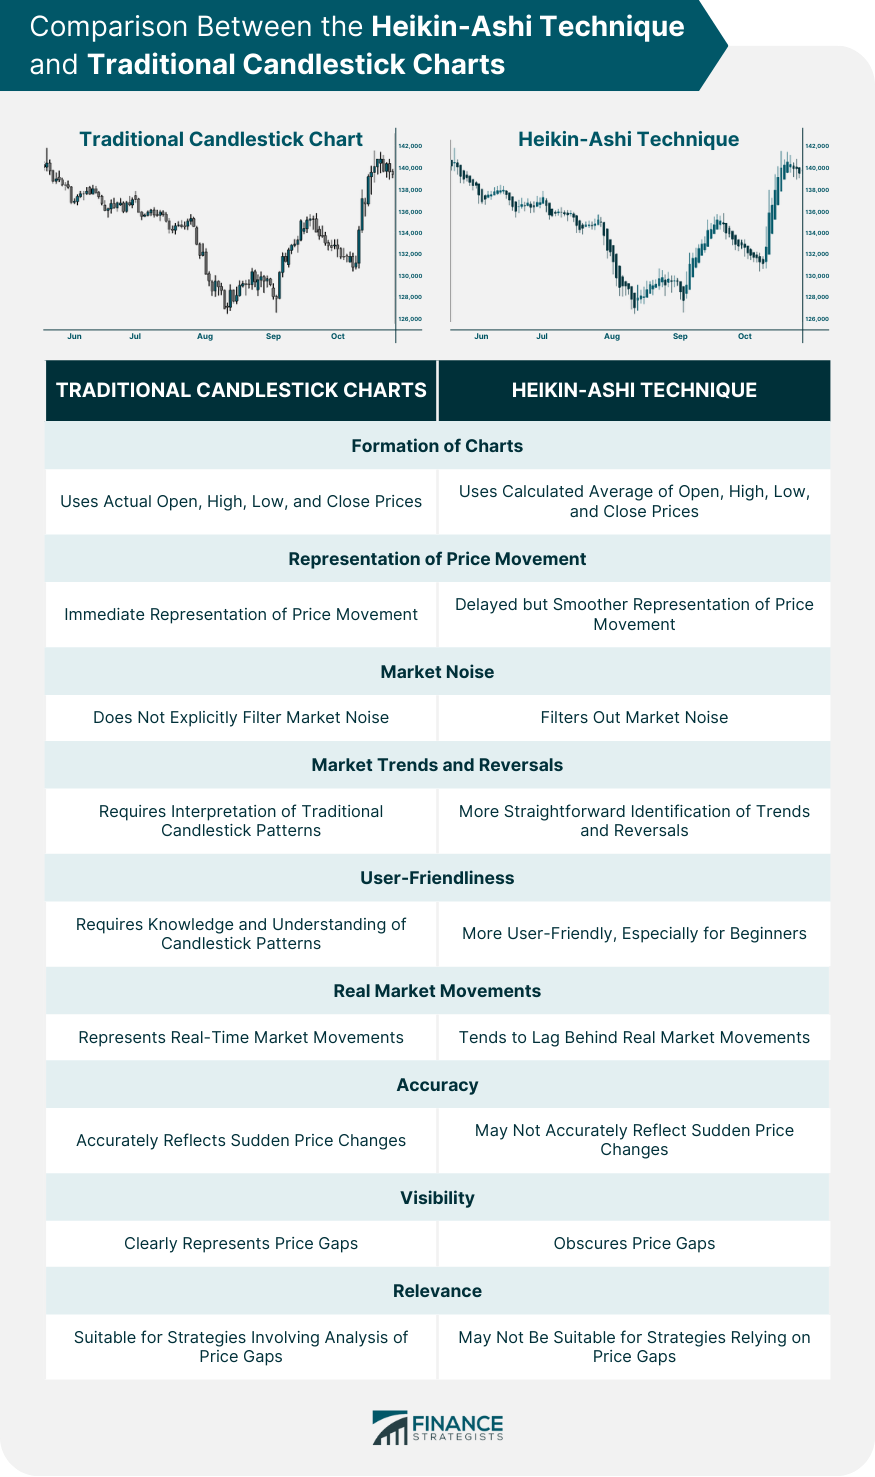
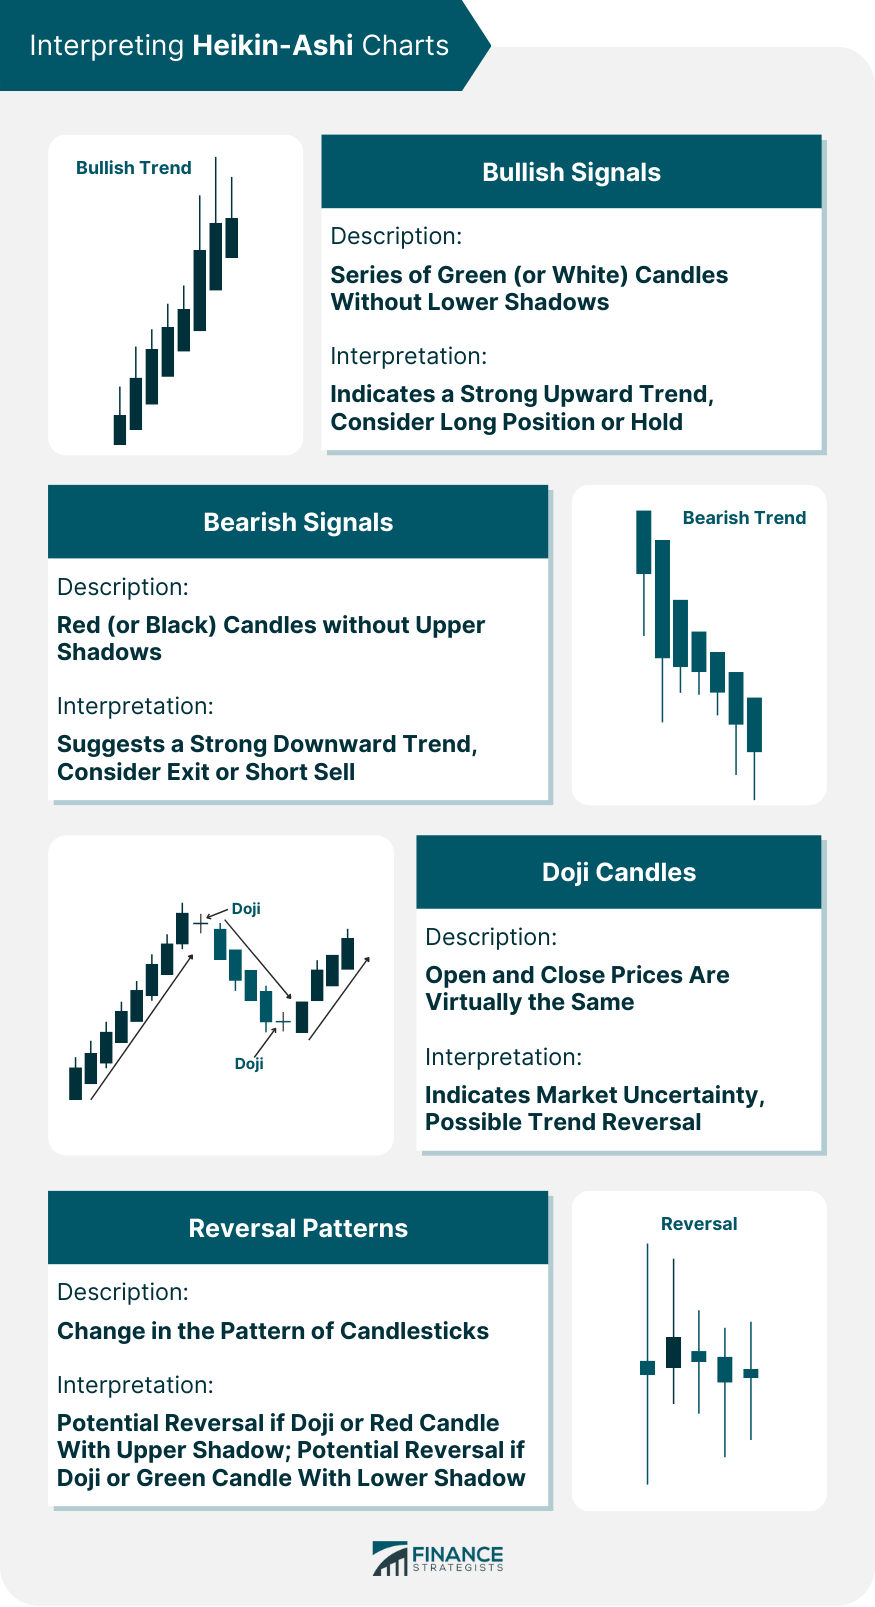
The Heikin-Ashi Technique is a notable tool in technical analysis that originates from Japan. It's part of the candlestick charting method, developed by a renowned Japanese rice merchant, Munehisa Homma, in the 18th century. Since then, it has evolved into a vital component of modern trading, assisting traders globally in identifying market trends and forecasting future price movements. "Heikin-Ashi" translates to "average bar" in English, reflecting the technique's unique way of calculating and displaying market price data. By using averages, it filters out market noise, leading to a smoother visual representation of market trends. The main objective of the Heikin-Ashi Technique is to offer a clearer picture of market trends by focusing on significant price moves and reducing unnecessary fluctuations. This simplified view enables traders to easily identify and follow trends, making the technique an invaluable asset in various trading strategies. While the Heikin-Ashi Technique and traditional candlestick charts share similar visual presentations, they differ significantly in formation. Traditional candlestick charts use the actual open, high, low, and close prices for their formation. In contrast, the Heikin-Ashi Technique uses a calculated average of these prices, resulting in a delayed but smoother representation of price movement. The Heikin-Ashi Technique's main advantage lies in its ability to filter out market noise. This leads to a more straightforward identification of market trends and potential reversals. It's also more user-friendly for traders, especially beginners who might struggle to interpret traditional candlestick patterns. However, this smoothing comes with a cost. Because the Heikin-Ashi Technique uses averaged prices, it tends to lag behind real market movements. This means it may not accurately reflect sudden price changes. It also obscures price gaps, which can be critical signals in other trading strategies. Creating Heikin-Ashi candles requires understanding mathematical calculations and applying them systematically to generate accurate charts. The process begins with understanding the basic data points needed and subsequently follows a specific sequence. The initial step in creating Heikin-Ashi candles involves understanding the formulas used to calculate the four key points - close, open, high, and low. These formulas use the open, high, low, and close from a regular price chart to derive their values. Grasping these calculations is crucial to developing accurate Heikin-Ashi candlesticks. The process commences with the calculation of the first Heikin-Ashi candlestick. This involves determining the close, open, high, and low of this candlestick based on the open, high, low, and close of the first period from the regular price chart. This step sets the stage for creating the subsequent Heikin-Ashi candlesticks. Following the creation of the first Heikin-Ashi candlestick, the process of calculating subsequent candlesticks begins. From the second Heikin-Ashi candlestick onwards, each candle's open is calculated using the previous Heikin-Ashi candle's open and close. Meanwhile, the high, low, and close are calculated based on the current period's price data and the previous Heikin-Ashi candle's open and close. Continuing this process for each period of price data will generate a complete Heikin-Ashi chart. This methodical approach ensures that each Heikin-Ashi candlestick accurately reflects the trend information, smoothing out the price action and making the trend easier to spot. In Heikin-Ashi charts, bullish signals are typically represented by a series of green (or white, depending on the color scheme) candles without lower shadows. This pattern indicates a strong upward trend, implying that it may be a good time to consider a long position or stay in an existing one. Conversely, bearish trends are represented by red (or black) candles without upper shadows. A sequence of such candles suggests a strong downward trend, potentially signaling a good time to exit or short sell a position. Doji candles in Heikin-Ashi charts, similar to traditional candlestick charts, indicate uncertainty in the market. A doji candle forms when the open and close prices are virtually the same. In a Heikin-Ashi chart, this could signal a possible trend reversal, especially if observed after a long streak of bullish or bearish candles. Reversal patterns in Heikin-Ashi charts are usually identifiable as a change in the pattern of candlesticks. For instance, a bullish trend could be reversing if a doji candle or a red candle with an upper shadow follows a series of green candles. Conversely, a bearish trend could be ending if a doji or a green candle with a lower shadow appears after a sequence of red candles. Recognizing these patterns can provide valuable insight into potential market turnarounds. Heikin-Ashi charts provide a straightforward way to determine market trends. A series of green candles, particularly those without lower shadows, indicate a bullish trend. On the other hand, a series of red candles, especially those without upper shadows, suggest a bearish trend. Doji candles or candles contrasting the existing trend might indicate a potential trend reversal. Heikin-Ashi charts are versatile and can be used in various market conditions. In trending markets, they help maintain positions by eliminating the noise of minor reversals. In volatile markets, the charts can help identify trend strength and potential reversal points. However, in ranging markets, Heikin-Ashi charts might produce many false signals and are typically less effective. Heikin-Ashi charts can be incorporated into trading strategies as a tool for identifying trends and potential reversal points. They can also be used in conjunction with other technical analysis tools, such as support and resistance levels, moving averages, or momentum oscillators to confirm signals and reduce false positives. The use of averaged price data in Heikin-Ashi charts means that some information is lost, particularly about intraday volatility and gaps, which might be crucial for some trading strategies. As Heikin-Ashi charts are based on averaged data, they may give delayed signals compared to traditional candlestick charts. This might lead to late entries or exits in fast-moving markets. In Heikin-Ashi charts, price gaps, which can be significant in markets like stocks, are smoothed out and not visibly noticeable. While this helps in trend identification, it might downplay important price shocks. Traders can leverage the strength of Heikin-Ashi charts by combining them with other technical analysis tools. For example, using Heikin-Ashi with moving averages can help confirm trend directions, while combining it with volume indicators can offer additional validation of market strength. In the realm of algorithmic trading, Heikin-Ashi can be used to create trading algorithms based on trend-following or reversal strategies. Algorithms can be programmed to enter or exit trades based on the color change of Heikin-Ashi candlesticks or the appearance of specific candlestick patterns. While often used by short-term traders, Heikin-Ashi charts are also useful for long-term investment strategies. They can provide a macro view of market trends, helping investors decide when to enter or exit positions. The Heikin-Ashi technique, derived from Japanese candlestick charting, is a powerful tool for trend recognition in financial markets. It averages price data from two periods to produce a smoothed chart, assisting traders in identifying market trends and potential reversals. Unique formulas are used to construct Heikin-Ashi charts, averaging open, high, low, and close prices from current and previous periods. Bullish and bearish trends are represented by green and red candles, respectively, while doji candles can suggest possible reversals. However, the technique may obscure certain details, like intraday volatility and price gaps, and can slightly delay signals due to the averaging process. Therefore, it should be used alongside other technical analysis tools. Despite its utility, a comprehensive investment strategy also considers factors like financial goals, risk tolerance, and investment horizon. For assistance in navigating financial complexities, consider professional wealth management services.What Is Heikin-Ashi Technique?
Comparison Between the Heikin-Ashi Technique and Traditional Candlestick Charts
Key Differences in Formation
Advantages and Disadvantages of Heikin-Ashi Compared to Traditional Candlestick Charts
How to Construct a Heikin-Ashi Chart
Understanding the Basic Heikin-Ashi Formulas
Calculating the First Heikin-Ashi Candlestick
Developing the Second Heikin-Ashi Candlestick and Beyond
Interpreting Heikin-Ashi Charts
Understanding Bullish Signals in Heikin-Ashi Charts
Understanding Bearish Signals in Heikin-Ashi Charts
How to Interpret Doji Candles in Heikin-Ashi Charts
Recognizing Reversal Patterns and Signals
Using the Heikin-Ashi Technique in Trading
Determining Trend Direction Using Heikin-Ashi Charts
How to Use Heikin-Ashi Charts in Different Market Conditions
Incorporating Heikin-Ashi Charts in Your Trading Strategy
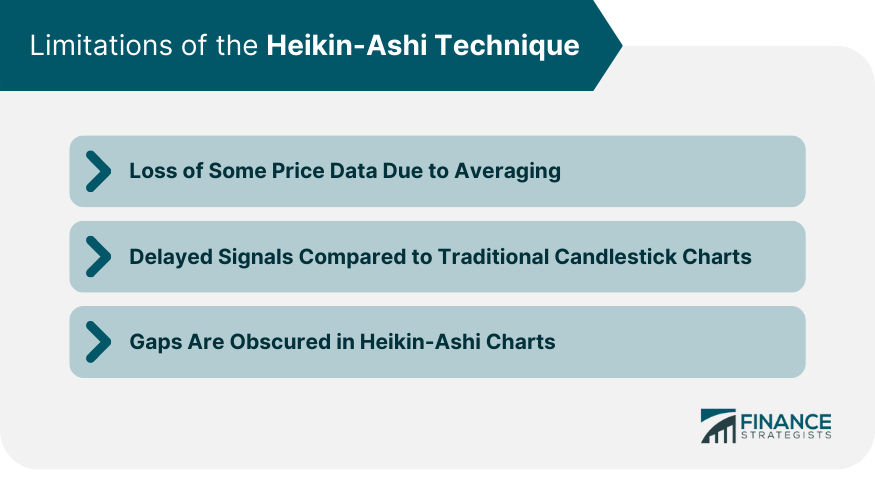
Limitations of the Heikin-Ashi Technique
Loss of Some Price Data Due to Averaging
Delayed Signals Compared to Traditional Candlestick Charts
Gaps Are Obscured in Heikin-Ashi Charts
Advanced Strategies Using the Heikin-Ashi Technique
Combining Heikin-Ashi with Other Technical Analysis Tools
Incorporating Heikin-Ashi in Algorithmic Trading
Use of Heikin-Ashi Charts in Long-Term Investment Strategies
Final Thoughts
Heikin-Ashi Technique FAQs
The Heikin-Ashi technique is a form of candlestick charting that uses averaged price data from two periods to create a smoother visualization of market trends.
The Heikin-Ashi Technique differs from traditional candlestick charts as it uses averaged price data, resulting in a smoother chart that better highlights market trends and reduces market noise.
A Heikin-Ashi chart is constructed using a specific set of calculations based on the open, high, low, and close prices from the current and previous period.
The Heikin-Ashi Technique can obscure some price data due to averaging and might give delayed signals compared to traditional candlestick charts. It also smooths out price gaps, which can be significant in some trading strategies.
Yes, the Heikin-Ashi Technique can be effectively combined with other technical analysis tools like support and resistance levels, moving averages, and momentum oscillators to confirm signals and reduce false positives.
True Tamplin is a published author, public speaker, CEO of UpDigital, and founder of Finance Strategists.
True is a Certified Educator in Personal Finance (CEPF®), author of The Handy Financial Ratios Guide, a member of the Society for Advancing Business Editing and Writing, contributes to his financial education site, Finance Strategists, and has spoken to various financial communities such as the CFA Institute, as well as university students like his Alma mater, Biola University, where he received a bachelor of science in business and data analytics.
To learn more about True, visit his personal website or view his author profiles on Amazon, Nasdaq and Forbes.


