
The term Doji originates from the Japanese word for "mistake" or "blunder", signifying a situation in which the market could not decide. In the context of candlestick charting, a Doji is a pattern that appears when the opening and closing prices for a specific time period are virtually the same. This candlestick has an extremely small or nonexistent body, which means the market opened and closed at almost the same price. There are four primary types of Doji: the Standard Doji, the Long-Legged Doji, the Dragonfly Doji, and the Gravestone Doji. Each variation is characterized by distinct features that suggest different market sentiments. The Long-Legged Doji is a specific type of Doji candlestick where both the upper and lower shadows are considerably long. It is an important pattern in candlestick charting and is characterized by a long upper and lower shadow with the open and close prices at the center of the trading range. The length of the shadows in a Long-Legged Doji signifies extreme levels of volatility in the market during the trading period. The longer the shadows, the greater the indecision between buyers and sellers. This is because the prices were driven both significantly higher and lower than the opening price but still closed at or near the opening price. The key difference between a Long-Legged Doji and other types of Doji lies in the length of the shadows. For instance, a Standard Doji has relatively short shadows, indicating minor indecision in the market. In contrast, a Dragonfly Doji has a long lower shadow and no upper shadow, suggesting buying pressure after an initial drop in price. The formation of a Long-Legged Doji requires a specific set of market conditions. First, the market must experience significant trading within the period. The opening and closing prices should be nearly identical, representing the equilibrium between supply (selling) and demand (buying). However, throughout the trading period, both the bulls (buyers) and bears (sellers) have had their moments, pushing the price substantially higher and lower, which is indicated by the long shadows of the Doji. Market volatility plays a significant role in the creation of a Long-Legged Doji. The high volatility within the trading period leads to the formation of long shadows. This candlestick pattern often appears during periods of significant market news or events that create uncertainty among traders, leading to aggressive buying and selling within the same period. Trading volume is another crucial factor in the formation of a Long-Legged Doji. A higher trading volume may enhance the significance of the Doji, as it represents greater activity and interest in a particular price level. Thus, a Long-Legged Doji formed with high volume can be a strong signal of potential market reversal. A Long-Legged Doji is interpreted as a signal of market uncertainty. It indicates a struggle for position between buyers and sellers where neither has won the upper hand. The fact that prices moved significantly higher and lower but ended almost where they started shows that the market still determines its direction. The long shadows on both ends of a Long-Legged Doji represent increased volatility. This increased volatility can be interpreted as a period of indecision that might result in a strong move in either In the context of technical analysis, a Long-Legged Doji often serves as a signal for potential market reversal. This is especially true if the pattern appears after a prolonged uptrend or downtrend. The presence of a Long-Legged Doji indicates that the forces of supply and demand are nearing equilibrium, suggesting that the current trend may be losing momentum. A Long-Legged Doji doesn't usually provide a trading signal on its own. Rather, its significance increases when it forms near other supportive technical levels, such as trend lines, resistance, support, or Fibonacci retracement levels. Furthermore, it can provide more robust trading signals when seen as part of more complex patterns, such as a bullish or bearish Harami. Understanding and identifying a Long-Legged Doji can be important in risk management. For instance, if a trader is in a long position and a Long-Legged Doji appears, it might be a signal to tighten stop losses or consider exiting the position. This is because the Doji represents indecision in the market and a possible upcoming reversal. Traders often use the Long-Legged Doji as part of their broader trading strategies. While it shouldn't be used as a standalone indicator, it can provide valuable information about potential trend reversals when combined with other technical analysis tools. It can help traders to make better While the Long-Legged Doji can be a powerful tool, it has limitations. One of the primary issues is the risk of misinterpretations and false signals. Like any other technical analysis tool, a Long-Legged Doji is not infallible and can sometimes produce false signals. For instance, the pattern may appear, signaling a potential reversal, but the trend may continue unaffected. Given the risk of false signals, using confirmatory indicators in conjunction with a Long-Legged Doji is crucial. These could include other candlestick patterns, trend lines, resistance and support levels, and technical indicators like moving averages or the relative strength index (RSI). These additional tools can help validate the signals the Long-Legged Doji provided. When trading with the Long-Legged Doji, several best practices can increase your success rate: 1. Confirmation is Key: Always look for additional confirmatory signals before making a trade decision based on a Long-Legged Doji. This could include a subsequent candlestick pattern indicating reversal or continuation or a trend line or resistance/support level. 2. Consider the Market Context: The significance of a Long-Legged Doji can be amplified depending on where it appears in the market trend. If it appears after a prolonged uptrend or downtrend, it's more likely to signal a potential reversal. 3. Use with Other Indicators: Incorporate other technical analysis tools, such as moving averages, RSI, or MACD, to provide additional insight. Several common mistakes should be avoided when trading with the Long-Legged Doji: 1. Avoid Jumping the Gun: Don't make immediate trading decisions based solely on the appearance of a Long-Legged Doji. Wait for additional confirmation before taking action. 2.. Don't Ignore the Volume: The Long-Legged Doji is more significant if it's accompanied by high trading volume. 3. Avoid Relying Solely on the Pattern: No single technical analysis tool should be used in isolation. Always use the Long-Legged Doji as part of a broader trading strategy. The Long-Legged Doji is a valuable tool in technical analysis, providing traders with potential signals for market reversals. However, it should always be used in conjunction with other technical analysis tools and within the context of a comprehensive trading strategy. Keep in mind that the Long-Legged Doji represents a period of market indecision and increased volatility, and these factors must be considered when making trading decisions. The field of technical analysis, including studying candlestick patterns like the Long-Legged Doji, constantly evolves. Future research may explore the effectiveness of these patterns in various market conditions and how these can be combined with other emerging tools and techniques in financial markets. Successful trading requires a thorough understanding of various market signals and the ability to interpret them effectively. Wealth management firms and financial advisors can provide the necessary guidance to navigate the financial markets using tools like the Long-Legged Doji.What Is the Long-Legged Doji?
Creation of the Long-Legged Doji
Conditions for Formation
Role of Market Volatility
Importance of Trading Volume During Formation
Interpretation of the Long-Legged Doji
Indications of Market Uncertainty
Inference of Increased Volatility
Long-Legged Doji in Technical Analysis
Long-Legged Doji as a Signal for Potential Reversal
Relationship With Other Chart Patterns
Practical Use of the Long-Legged Doji
Role in Risk Management
Use in Developing Trading Strategies
Long-Legged Doji Limitations
Misinterpretations and False Signals
Necessity of Confirmatory Indicators
Expert Tips on Long-Legged Doji Trading
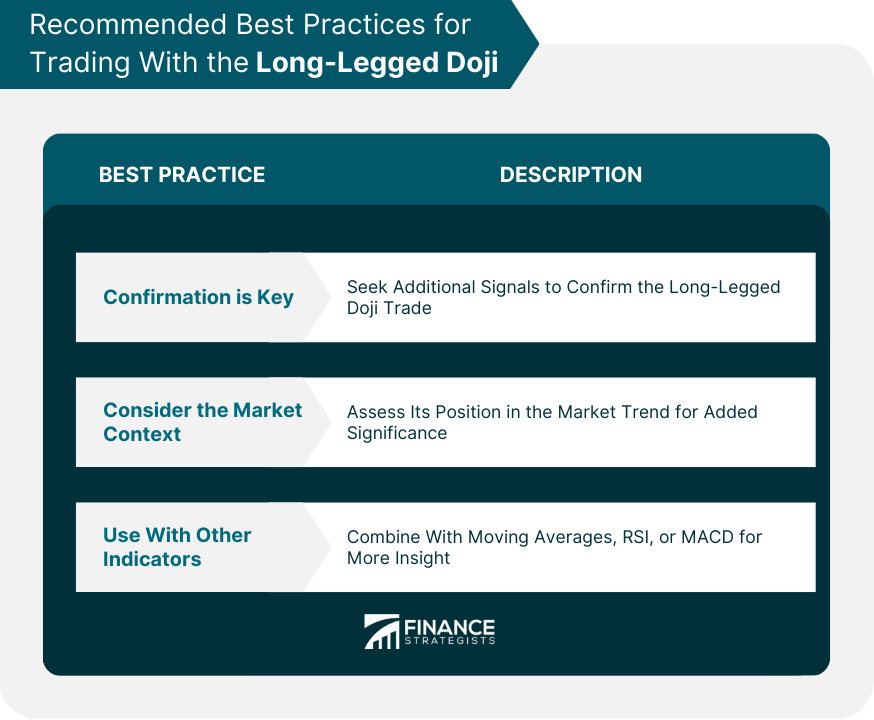
Recommended Best Practices
Common Mistakes to Avoid
Conclusion
Long-Legged Doji FAQs
A Long-Legged Doji represents a state of indecision in the market. The long upper and lower shadows reflect that prices moved significantly in both directions during the trading period but closed near where they opened. This pattern can often signal a potential reversal, particularly when it appears after a significant uptrend or downtrend.
The Long-Legged Doji is formed when the opening and closing prices of a trading period are nearly the same, and there were substantial price movements in both upward and downward directions during that period. This leads to the formation of long upper and lower shadows, indicative of high volatility.
The Long-Legged Doji is neither inherently bullish nor bearish. Instead, it signifies indecision in the market, with equal pressure from buyers and sellers. However, it can signal a potential reversal of the current trend. If it appears after a prolonged uptrend, it may suggest an upcoming bearish reversal and vice versa.
While the Long-Legged Doji can provide valuable insights into market sentiment, it should not be used in isolation due to the risk of false signals. Traders should always seek an additional confirmation from other technical analysis tools or subsequent candlestick patterns before making trading decisions based on a Long-Legged Doji.
The key difference between a Long-Legged Doji and a Standard Doji lies in the length of the shadows. The Long-Legged Doji has long upper and lower shadows, indicating substantial price movements in both directions during the trading period, while a Standard Doji has shorter shadows, reflecting less price fluctuation.
True Tamplin is a published author, public speaker, CEO of UpDigital, and founder of Finance Strategists.
True is a Certified Educator in Personal Finance (CEPF®), author of The Handy Financial Ratios Guide, a member of the Society for Advancing Business Editing and Writing, contributes to his financial education site, Finance Strategists, and has spoken to various financial communities such as the CFA Institute, as well as university students like his Alma mater, Biola University, where he received a bachelor of science in business and data analytics.
To learn more about True, visit his personal website or view his author profiles on Amazon, Nasdaq and Forbes.


