
The Golden Cross is a popular technical analysis indicator used in wealth management. It occurs when a shorter-term moving average, such as the 50-day moving average, crosses above a longer-term moving average, such as the 200-day moving average, on a price chart. The crossing of these moving averages is seen as a bullish signal, indicating a potential shift in the market trend. The Golden Cross holds significant importance in wealth management as it helps traders and investors identify potential buying opportunities and signals a shift towards a bullish market trend. It is widely used as a timing indicator for investment decisions, portfolio management, and identifying potential entry and exit points in the financial markets. By recognizing the Golden Cross and understanding its implications, traders and investors can optimize their strategies, enhance their portfolio performance, and make informed decisions to capitalize on potential market upswings. It serves as a valuable tool for wealth management professionals seeking to align their investments with favorable market conditions. The Golden Cross is a key concept in technical analysis, a discipline focused on analyzing historical price and volume data to predict future market trends. It is one of the most widely used indicators and is particularly popular among trend-following traders. When the Golden Cross occurs, it suggests a significant shift in market sentiment from bearish to bullish. It signifies that the price has gained upward momentum, with the shorter-term moving average crossing above the longer-term moving average. This bullish signal is often interpreted as a confirmation of positive market sentiment and a potential trend reversal. Traders and investors use the Golden Cross as part of their technical analysis toolkit to validate potential buying opportunities and assess the overall health of the market. It is often combined with other technical indicators, such as volume analysis or trendline patterns, to strengthen trading decisions and enhance the accuracy of market forecasts. To identify the Golden Cross, traders need to analyze moving averages on a price chart. Moving averages are calculated based on the average closing prices over a specified period and provide a smoothed line that helps filter out short-term price fluctuations. The Golden Cross occurs when the shorter-term moving average, such as the 50-day moving average, crosses above the longer-term moving average, such as the 200-day moving average. This crossover is visually represented on the price chart, providing a clear signal for traders to take note of potential bullish opportunities. The choice of timeframes for the moving averages used in the Golden Cross is crucial and depends on the trader's investment horizon and trading style. Shorter-term moving averages, such as the 50-day or 100-day moving averages, provide more immediate signals, while longer-term moving averages, such as the 200-day or 50-week moving averages, capture broader market trends. Traders should consider their investment goals and the market they are trading to determine the most appropriate timeframes for their moving averages. Different timeframes may yield different results, so it is essential to backtest and validate the chosen moving averages with historical data before incorporating them into trading strategies. While the Golden Cross itself is considered a bullish signal, it is often helpful to look for additional confirmation using chart patterns. Traders may analyze candlestick patterns, trendlines, or other technical indicators to strengthen the validity of the Golden Cross and increase the confidence in potential trading opportunities. Chart patterns that coincide with the Golden Cross, such as a breakout from a consolidation pattern or a bullish reversal pattern, can provide further confirmation of the upward price momentum. This confirmation helps traders make more informed decisions and reduces the risk of false signals. One of the key benefits of the Golden Cross in wealth management is its ability to assist in timing investment decisions. When the Golden Cross occurs, it signals a potential shift in the market sentiment from bearish to bullish. Traders and investors can use this signal to identify favorable entry points for long positions or to add to existing positions. By aligning their investments with the Golden Cross, traders and investors aim to capitalize on potential market upswings and position themselves to take advantage of the positive price momentum. This timing component can enhance portfolio performance and improve overall returns. The Golden Cross provides an additional layer of information for portfolio managers to assess the health of their investments. By incorporating the Golden Cross into portfolio analysis, managers can gain insights into the overall market trends and adjust their portfolio allocations accordingly. When the Golden Cross occurs, it suggests a potential shift towards a bullish market trend, which may indicate a favorable environment for certain asset classes or sectors. Portfolio managers can leverage this information to allocate their assets strategically and enhance the performance of their portfolios. The Golden Cross is a valuable tool for identifying potential entry and exit points in the market. When the Golden Cross occurs, it signifies a change in market sentiment and suggests that the price is likely to continue its upward momentum. Traders can use the Golden Cross to time their entry into long positions, seeking to capture the potential price appreciation that may follow. Additionally, the Golden Cross can serve as a signal to exit existing short positions, as the bullish market sentiment may invalidate the bearish thesis. By utilizing the Golden Cross to identify entry and exit points, traders can optimize their trading strategies, minimize risks, and increase the probability of profitable trades. One of the limitations of the Golden Cross is the possibility of false signals and whipsaws. A false signal occurs when the Golden Cross forms, but the price fails to sustain its upward momentum and reverses direction shortly after the crossover. This can result in losses for traders who rely solely on the Golden Cross without considering other confirming factors. To mitigate the risk of false signals, traders often employ additional technical indicators or use a combination of multiple moving averages with different timeframes to increase the robustness of their trading strategies. This helps filter out potential false signals and reduces the impact of whipsaws. The Golden Cross relies on historical data, particularly the calculation of moving averages. This reliance on historical price data may limit the effectiveness of the Golden Cross in rapidly changing or highly volatile market conditions. Traders should be aware that the Golden Cross is a lagging indicator, as it is based on past price movements. It may not capture sudden market shifts or provide timely signals in fast-moving markets. Therefore, it is essential to consider other technical indicators, market fundamentals, and current market conditions when incorporating the Golden Cross into trading strategies. While the Golden Cross is a useful tool in wealth management, it is important to consider it in conjunction with other factors for comprehensive analysis. Technical analysis should be complemented with fundamental analysis, market sentiment, and other relevant indicators to make well-rounded trading decisions. Traders should avoid solely relying on the Golden Cross and incorporate a multi-dimensional approach to their analysis. By considering multiple factors, traders can gain a more complete understanding of the market dynamics and make more informed trading decisions. The Golden Cross is often compared to its counterpart, the Death Cross. While the Golden Cross is a bullish signal, indicating a potential trend reversal from bearish to bullish, the Death Cross is a bearish signal that occurs when the shorter-term moving average crosses below the longer-term moving average. The key difference between the Golden Cross and Death Cross lies in the implications for market sentiment. The Golden Cross suggests a shift towards a bullish trend, while the Death Cross implies a transition to a bearish trend. Traders and investors should be aware of both the Golden Cross and Death Cross and consider them in conjunction with other technical indicators. By doing so, they gain a more comprehensive understanding of the market conditions and potential trading opportunities. The Golden Cross is a technical analysis indicator used in wealth management to identify potential market reversals. It occurs when a shorter-term moving average crosses above a longer-term moving average, signaling a shift towards a bullish market trend. Traders can identify the Golden Cross by analyzing moving averages on a price chart and determining the timeframes for the moving averages. Chart patterns can also be used to confirm the Golden Cross and strengthen trading decisions. The Golden Cross offers benefits in terms of timing investment decisions, enhancing portfolio performance, and identifying potential entry and exit points. However, it also has limitations, including the risk of false signals and the dependence on historical data. Traders should consider these factors and employ a multi-dimensional approach to their analysis. The Golden Cross holds significant importance in wealth management as it provides traders and investors with valuable insights into potential market reversals and helps align investments with favorable market conditions.What Is the Golden Cross?
Golden Cross in Technical Analysis
Identifying the Golden Cross
Analyzing Moving Averages
Determining the Timeframes for Moving Averages
Using Chart Patterns to Confirm the Golden Cross
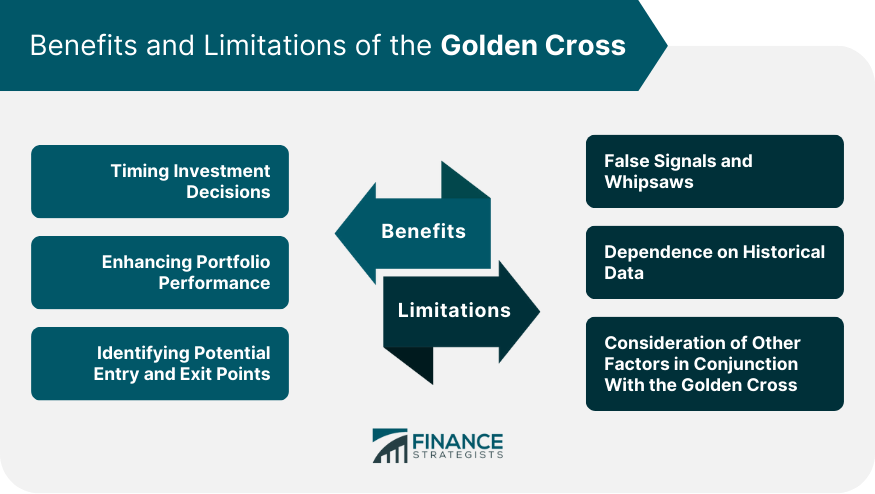
Benefits of the Golden Cross
Timing Investment Decisions
Enhancing Portfolio Performance
Identifying Potential Entry and Exit Points
Limitations of the Golden Cross
False Signals and Whipsaws
Dependence on Historical Data
Consideration of Other Factors in Conjunction With the Golden Cross
Golden Cross vs Death Cross
Conclusion
Golden Cross FAQs
The Golden Cross is a technical analysis indicator that occurs when a shorter-term moving average crosses above a longer-term moving average, signaling a potential shift towards a bullish market trend.
The Golden Cross is used in wealth management to time investment decisions, enhance portfolio performance, and identify potential entry and exit points.
Limitations of the Golden Cross include the risk of false signals and whipsaws, dependence on historical data, and the importance of considering other factors in conjunction with the Golden Cross.
The Golden Cross is a bullish signal indicating a potential trend reversal from bearish to bullish, while the Death Cross is a bearish signal that occurs when the shorter-term moving average crosses below the longer-term moving average.
Traders can validate the Golden Cross by using additional technical indicators, analyzing chart patterns, and considering current market conditions to strengthen the validity of potential trading opportunities.
True Tamplin is a published author, public speaker, CEO of UpDigital, and founder of Finance Strategists.
True is a Certified Educator in Personal Finance (CEPF®), author of The Handy Financial Ratios Guide, a member of the Society for Advancing Business Editing and Writing, contributes to his financial education site, Finance Strategists, and has spoken to various financial communities such as the CFA Institute, as well as university students like his Alma mater, Biola University, where he received a bachelor of science in business and data analytics.
To learn more about True, visit his personal website or view his author profiles on Amazon, Nasdaq and Forbes.


