
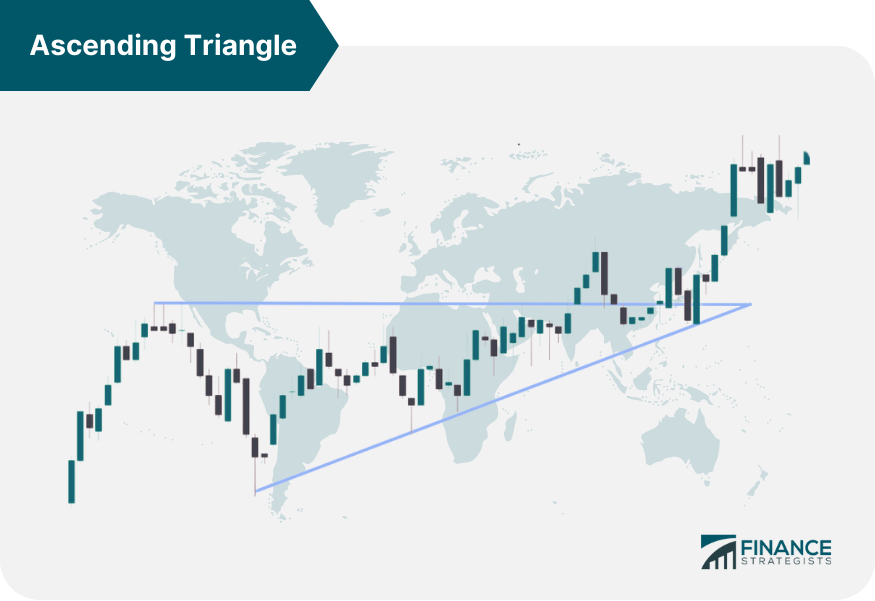
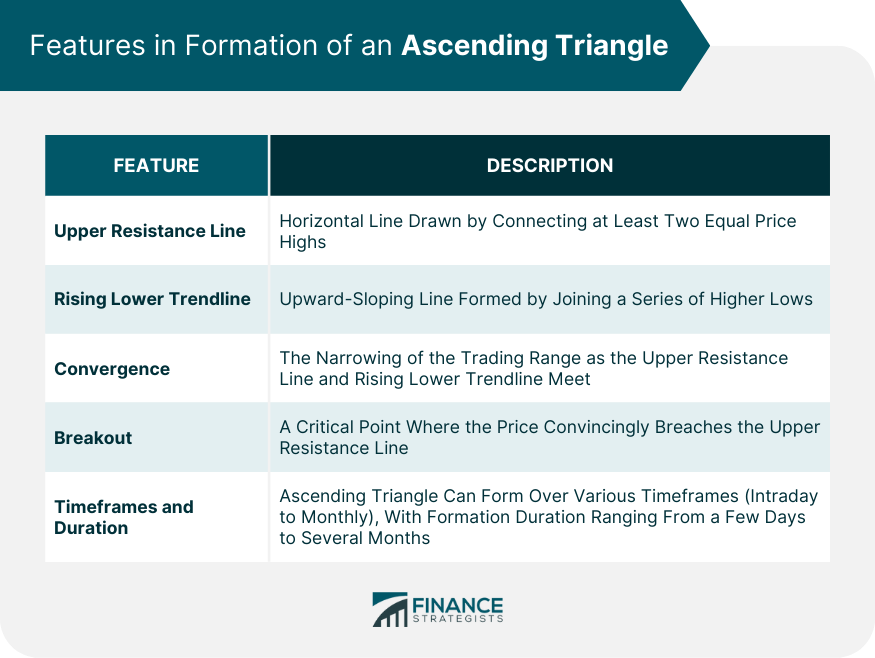
An ascending triangle is a bullish chart pattern used in technical analysis that is easily recognizable by its distinctive shape. This pattern is formed by two trendlines: a horizontal trendline representing a level of resistance, which is touched by price peaks, and an upward-sloping trendline representing increasing levels of support, which connects price lows. The 'triangle' is completed when the price breaks out of these bounds, typically continuing in the direction of the pre-existing trend, which is upwards in the case of the ascending triangle. It's seen as a continuation pattern, occurring during an upward trend and signaling its likely continuation once the pattern is completed. In technical analysis, chart patterns like ascending triangles are used to predict future price movements based on historical data. Traders and investors utilize these patterns to identify potential buy or sell signals, helping them make informed decisions. The ascending triangle, as a bullish continuation pattern, is considered a reliable signal that the asset's price is likely to move upward after the breakout. Two crucial elements define an ascending triangle - the upper resistance line and the rising lower trendline. The upper resistance line, typically horizontal, is drawn by connecting a minimum of two equal price highs. This line represents a level where selling pressure has been consistently absorbed. Conversely, the rising lower trendline, drawn by joining a sequence of higher lows, showcases increasing buying pressure over time. As the price oscillates within the boundaries of the triangle, the trading range starts to constrict. This convergence of the two trendlines leads to a critical breakout point, usually where the price convincingly breaches the upper resistance line. Ascending triangle patterns can emerge across a variety of timeframes, encompassing intraday, weekly, or even monthly charts. The significance of the pattern and its subsequent breakout typically enhances with longer timeframes. The formation process of an ascending triangle can span from just a few days to several months, underlining its flexibility and wide usage in various market conditions. The ascending triangle pattern is considered a bullish indicator because it generally precedes an upward price movement. As the pattern develops, the rising lower trendline shows increasing buying pressure, while the upper resistance line demonstrates a strong level where selling pressure has previously been absorbed. The breakout above the resistance line indicates that buyers have finally overcome sellers, leading to a continuation of the bullish trend. Volume plays a crucial role in confirming the validity of an ascending triangle pattern. An increase in volume during the breakout is a strong confirmation signal, suggesting that the breakout is genuine and that the bullish trend is likely to continue. On the other hand, a breakout with low volume might be less reliable, increasing the chances of a false breakout or a reversal. The upper resistance line in an ascending triangle pattern is drawn horizontally. This is because it represents a level at which the price of the asset can't seem to break through. To draw this line, you need to find at least two high points that reach the same price level. The lower trendline, on the other hand, is ascending. This is due to the fact that each low point is higher than the last, indicating an upward trend. You'll need to find at least two low points that do not reach the same price level but create an upward slope when connected. Draw a line through these points, extending it towards the resistance line. In an ascending triangle, the resistance line and the ascending lower trendline should converge towards the right, forming a triangle shape. This represents the fact that the price is making higher lows but not managing to make higher highs. The convergence is seen as a period of consolidation before a possible breakout. A breakout refers to the point when the price of the asset moves outside of the ascending triangle, either above the resistance line or below the trendline. A breakout above the resistance line is generally seen as a bullish sign and could indicate a buying opportunity, whereas a breakout below the trendline could be seen as a bearish signal and possibly a selling opportunity. A breakout refers to the point where the price breaks through the resistance or support line of a chart pattern. In the case of an ascending triangle, a breakout is typically expected to occur on the upper resistance line, signifying the continuation of the bullish trend. The likelihood and direction of breakouts in ascending triangles can be influenced by several factors, including volume, the prevailing market trend, and other technical indicators. As mentioned earlier, a breakout with a high volume is generally considered more reliable. Additionally, if the ascending triangle forms during an uptrend, the breakout will likely be bullish. Traders often enter a long position when the price breaks out of the ascending triangle pattern to the upside, especially if the breakout is confirmed by high volume. The initial stop loss can be set just below the breakout point or the rising lower trendline. The potential profit target can be calculated by measuring the height of the triangle (the distance from the upper resistance line to the first low in the triangle) and projecting that distance from the breakout point. Effective risk management is crucial in any trading strategy, including those based on ascending triangles. Setting stop loss levels can help protect against significant losses if the price reverses after the breakout. Similarly, taking profit levels can help ensure profits are realized before the price reverses. Like any chart pattern, ascending triangles are not foolproof and can lead to misinterpretations and false breakouts. For instance, a trader might misidentify a pattern as an ascending triangle, or the price might break out of the triangle only to quickly reverse direction. It's essential to use other technical indicators and analysis techniques to validate the pattern and breakout. To minimize the risks of misinterpretations and false breakouts, traders should supplement ascending triangle patterns with other indicators, such as moving averages, MACD, RSI, and Fibonacci retracement levels. Using a combination of indicators can help confirm the validity of the ascending triangle and the potential breakout. The descending triangle is the bearish counterpart to the ascending triangle. Lower highs and a horizontal support line characterize it. While ascending triangles are typically bullish continuation patterns, descending triangles are usually bearish continuation patterns. Despite these differences, both patterns are formed by a horizontal line and a sloping line, representing strong support or resistance and a trend of increasing buying or selling pressure, respectively. A symmetrical triangle is another common chart pattern formed by a series of lower highs and higher lows, creating a pattern with two converging trendlines. Unlike ascending and descending triangles, which typically signal a continuation of the existing trend, symmetrical triangles can be either a continuation or reversal pattern. The direction of the breakout will determine whether the symmetrical triangle is a bullish or bearish pattern. The ascending triangle, a bullish pattern in technical analysis, is defined by its distinctive form: a horizontal upper resistance line and a rising lower trendline. Its formation is dictated by price trends that touch the resistance and support lines, creating a triangular shape. Interpreting this pattern is critical in predicting potential future price movements. The pattern signifies an upward trend continuation, especially when the price breaks out from the triangle's bounds. Importantly, the convergence of ascending lows and a static resistance level reflects a balance shift from sellers to buyers. When these key characteristics align, the ascending triangle acts as a signal for traders and investors, pointing to a likely continuation of a bullish market. However, this tool should be used with other technical indicators for optimal results. Essentially, the ascending triangle's power lies in its predictive capacity for trend continuation.What Is the Ascending Triangle?
Significance of Ascending Triangle
Formation of an Ascending Triangle
Identification of the Key Features
Timing and Duration of Formation
Interpretation of Ascending Triangle Patterns
Bullish Indicator: Implications for Traders and Investors
Importance of Volume in Confirmation
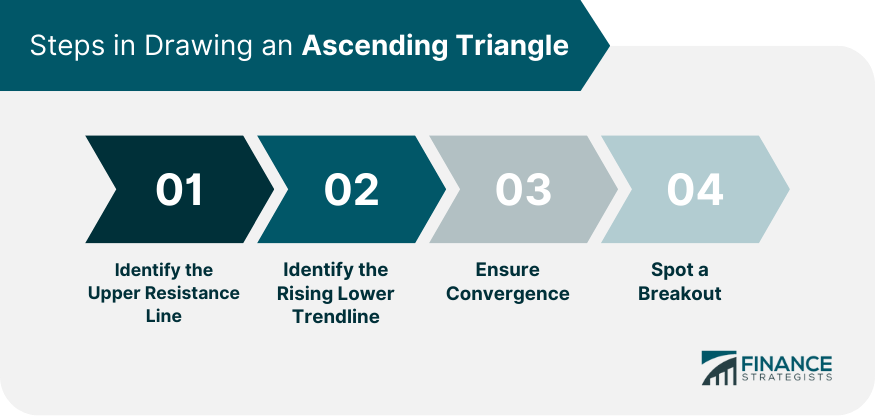
Drawing an Ascending Triangle
Identifying the Upper Resistance Line
Identifying the Rising Lower Trendline
Ensuring Convergence
Spotting a Breakout
Breakouts in Ascending Triangle Patterns
Understanding the Concept of Breakout
Factors Influencing the Likelihood and Direction of Breakouts
Trading Strategies Based on Ascending Triangles
Entry and Exit Points
Risk Management: Setting Stop Loss and Take Profit Levels
Limitations and Risks of Using Ascending Triangle Patterns
Misinterpretations and False Breakouts
Importance of Supplementing With Other Indicators
Comparison of Ascending Triangle With Other Chart Patterns
Differences and Similarities with Descending Triangle
Contrast With Symmetrical Triangle
Final Thoughts
Ascending Triangle FAQs
An ascending triangle is a bullish continuation pattern characterized by a series of higher lows and a horizontal resistance line, forming a triangular shape on the price chart.
An ascending triangle is formed by a horizontal upper resistance line, created by connecting at least two roughly equal price highs, and a rising lower trendline, formed by connecting a series of higher lows.
An ascending triangle generally indicates a forthcoming bullish breakout and the continuation of the prevailing upward trend.
Traders use ascending triangles to identify potential buy signals. They typically enter a long position when the price breaks out of the triangle to the upside, especially if the breakout is confirmed by high volume.
Ascending triangle patterns can lead to misinterpretations and false breakouts. Traders should use other technical indicators and analysis techniques to confirm the validity of the pattern and the breakout.
True Tamplin is a published author, public speaker, CEO of UpDigital, and founder of Finance Strategists.
True is a Certified Educator in Personal Finance (CEPF®), author of The Handy Financial Ratios Guide, a member of the Society for Advancing Business Editing and Writing, contributes to his financial education site, Finance Strategists, and has spoken to various financial communities such as the CFA Institute, as well as university students like his Alma mater, Biola University, where he received a bachelor of science in business and data analytics.
To learn more about True, visit his personal website or view his author profiles on Amazon, Nasdaq and Forbes.


