
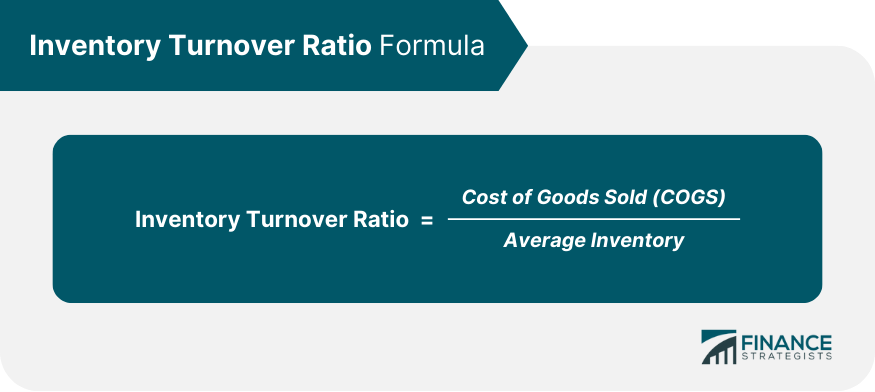
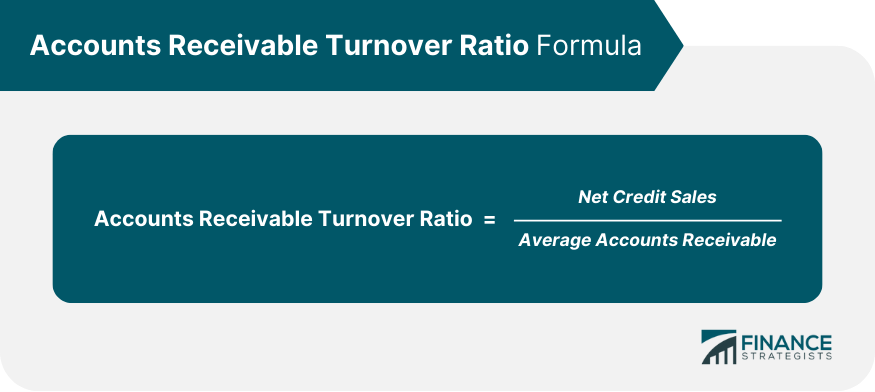
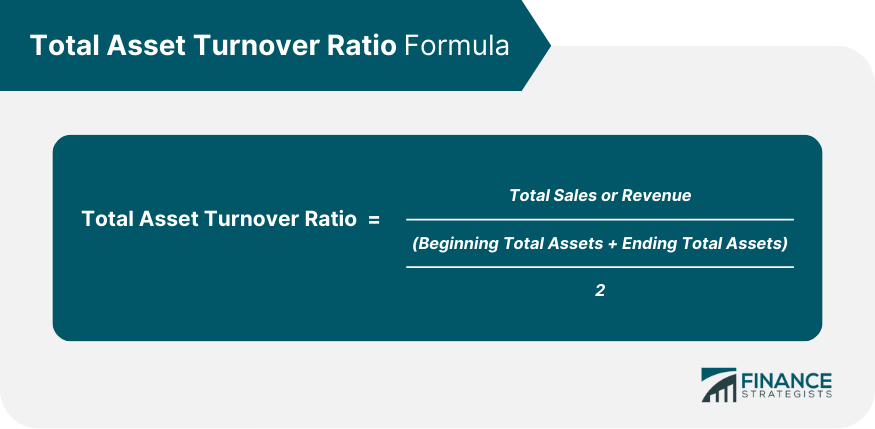
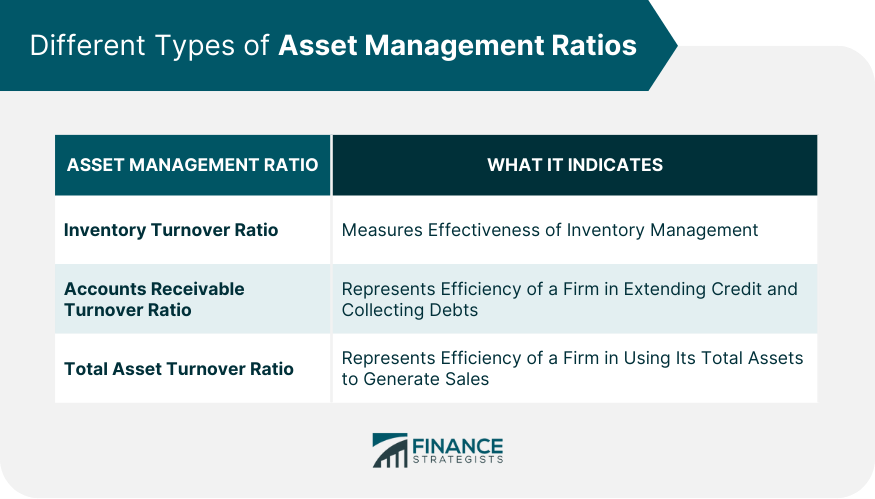
Asset management ratios, also known as efficiency or turnover ratios, are a set of financial metrics used to gauge a company's ability to generate revenue from its assets. These ratios are vital financial indicators used by managers, analysts, and investors to understand how effectively a company is using its assets to produce income. For a business aiming to scale up or for an investor eyeing to put money in a company, these ratios can be incredibly informative. The primary purpose of these ratios is to assess the effectiveness of a company in utilizing its assets. Importance is underlined by their contribution to financial analysis, offering insights into business operations that are otherwise hard to obtain. They serve as key indicators of operational efficiency and profitability. Furthermore, they provide an objective measure for comparing the performance of different companies within the same industry, leveling the playing field for all involved parties. Asset management ratios are calculated by dividing the revenue by various types of assets. The interpretation of these ratios depends on the industry norms, historical data, and the company's performance. A higher ratio indicates more efficient use of the assets to generate sales. However, too high a ratio could mean the company is overworking its assets, which might not be sustainable in the long run. Asset management ratios can be subdivided into three main types: The Inventory Turnover Ratio is a key measure for evaluating how effectively a company manages its inventory. It demonstrates the number of times a company sold its total inventory within a specified timeframe, typically a year. The formula for calculating the Inventory Turnover Ratio is: The Cost of Goods Sold (COGS) represents the direct costs associated with producing the goods sold by a company. This includes the cost of the materials used in creating the good along with the direct labor costs used to produce the good. Average Inventory is typically calculated as the average of the beginning and ending inventory for the time period. It is important to note that a high Inventory Turnover Ratio may indicate strong sales or effective inventory management, while a low ratio may indicate weak sales and/or poor inventory management. However, these interpretations may depend on the industry and other factors. For example, in an industry where goods are produced and sold quickly (like a grocery store), a high Inventory Turnover Ratio is generally positive. In industries with longer production cycles, a lower ratio might be expected. The Accounts Receivable Turnover Ratio is a measure that indicates the efficiency with which a business extends credit and collects debts. Essentially, it measures how effectively a business is managing its accounts receivables. The formula to calculate the Accounts Receivable Turnover Ratio is: Net Credit Sales represent the sales made on credit, not including cash transactions, within a specified period. It's important to note that only credit sales are considered in the formula, as cash doesn't create an account receivable. Average Accounts Receivable is the average of the opening and closing accounts receivable balances for the time period. The Accounts Receivable Turnover Ratio indicates how many times a business can turn its accounts receivables into cash over a given period. A high ratio could imply that the company operates on a cash basis or it has stringent credit policies, while a low ratio might indicate that the company has difficulty collecting from its customers, possibly due to a poor collection process or credit policies that are too lax. However, the interpretation of a "high" or "low" ratio can depend on the industry, the comparison with competitors, or trends within the company itself over time. For instance, a high ratio may be common in industries where credit sales are collected quickly, while a lower ratio may be typical in industries where credit terms are longer, or receivables collection is slower. The Total Asset Turnover Ratio is a financial metric that measures the efficiency of a company in using its assets to generate sales. It shows how well a company is using its assets to produce revenue. The higher the ratio, the better a company is performing. The formula for the Total Asset Turnover Ratio is: Total Sales or Revenue is the total income from a company’s primary business operations. The Beginning Total Assets and Ending Total Assets are the total value of all short-term and long-term assets at the beginning and the end of the period, respectively. The average is typically used to account for fluctuations in the asset base during the period. A high Total Asset Turnover Ratio suggests that a company is using its assets effectively to generate sales, which may be an indicator of management efficiency. A low ratio, on the other hand, may indicate that a company has invested in assets that are not effectively generating revenue. Asset management ratios offer deep insights into a company's operational efficiency by demonstrating how well it uses its assets to generate income. By comparing these ratios with those of other companies in the same industry, managers can identify areas of strength and weakness, providing valuable information for strategic planning. It's an effective way to benchmark the performance of a company against industry standards. Asset management ratios allow for a comparative analysis of various firms in the same industry or sector. By evaluating these ratios, investors can identify industry leaders and laggards, helping them make informed investment decisions. These ratios not only allow the identification of companies that stand out in operational efficiency but also help in spotting potential red flags in businesses that underperform. Asset management ratios help stakeholders understand how efficiently a company uses its assets. These ratios provide a snapshot of how many times a company turns its assets into revenue during a specific period, which can help identify problems like excessive inventory or uncollected receivables. Over time, monitoring these ratios can reveal trends in a company's operational efficiency, providing valuable data for strategic decision-making. These ratios allow analysts to make insightful comparisons across different industries. By understanding industry averages for different asset management ratios, one can better gauge a company's performance. This comparative perspective can reveal the strengths and weaknesses of a company within its operational landscape, providing a more rounded view of its performance. From an investor's perspective, asset management ratios are crucial for investment decision-making. These ratios can provide investors with information about a company's operational efficiency and how well it's performing relative to its peers. By offering a glimpse into the internal workings of a company, these ratios can help investors identify potentially profitable investments and avoid those that pose higher risks. One of the most significant challenges with these ratios is that they rely heavily on historical data, and past performance doesn't necessarily predict future results. Economic conditions, market competition, and technological changes can all influence a company's ability to generate sales from its assets. Hence, while they provide a historical context, their predictive ability for future performance can be limited. These ratios, by design, fail to consider the prevailing market conditions, which may affect a company's asset management. Economic downturns or upturns can drastically influence a firm's asset utilization efficiency, and these fluctuations may not be reflected in the ratios. This omission can lead to a skewed interpretation of the company's efficiency, if not considered in the context of current market conditions. Asset management ratios can also vary widely across different industries. As a result, they may not always provide an accurate comparison if used to compare companies from different sectors. For instance, service industries typically have lower asset management ratios than manufacturing industries due to their different business models and asset utilization. Therefore, it's crucial to compare these ratios within the context of the respective industry. Investors frequently use asset management ratios to help make investment decisions. By analyzing these ratios, they can gain insights into a company's operational efficiency, which can significantly impact their decision to invest or not. Moreover, these ratios help an investor understand the company's management's effectiveness in using resources, which is a critical factor to consider while investing. Companies use these ratios to assess their performance over time and against competitors. By monitoring changes in their asset management ratios, they can identify potential problems in their operations and take corrective actions. Thus, they serve as a tool for continuous improvement, enabling firms to maximize their resources and improve their profitability. These ratios also provide crucial inputs for strategic planning. Managers can use them to identify areas where the company's asset utilization can be improved. This could involve speeding up the inventory turnover process, improving receivables collection, or better managing total assets. With these insights, businesses can focus their efforts on enhancing efficiency, leading to a more profitable and sustainable operational structure. Asset management ratios serve as crucial tools in evaluating a company's operational efficiency, facilitating investment decision-making, assessing business performance, and strategic planning. These ratios provide valuable insights into how effectively a company is using its assets to generate income, offering an objective measure for comparison within industry norms. However, they come with limitations, such as an over-reliance on historical data, insensitivity to current market conditions, and potential misinterpretation due to industry variations. It's imperative to consider these factors while analyzing the company's performance using these ratios. As an investor, understanding asset management ratios can significantly enhance your decision-making capabilities, helping you identify potentially profitable ventures. To fully harness the potential of this tool, consider seeking professional wealth management services. They can provide expert guidance, making complex financial analysis more accessible and informative, ultimately leading to more astute investment decisions.What Are Asset Management Ratios?
How Asset Management Ratios Work
Calculation and Interpretation
Different Types of Asset Management Ratios
Inventory Turnover Ratio
Accounts Receivable Turnover Ratio
Total Asset Turnover Ratio
Significance of Asset Management Ratios in Financial Analysis
Assess Operational Efficiency
Use in Comparing Business Performance
Benefits of Using Asset Management Ratios
Better Understanding of Asset Utilization
Insightful Comparisons Across Industries
Enhanced Investment Decision-Making
Drawbacks and Limitations of Asset Management Ratios
Over-Reliance on Historical Data
Insensitivity to Market Conditions
Risk of Misinterpretation Due to Industry Variations
Practical Applications of Asset Management Ratios
Investment Decision-Making
Business Performance Evaluation
Strategic Planning for Operational Efficiency
Final Thoughts
Asset Management Ratios FAQs
Asset management ratios, often called efficiency or turnover ratios, measure a company's ability to generate revenue from its assets.
They provide insights into a company's operational efficiency, informing investment decisions and strategic planning.
These ratios are computed by dividing the revenue by various types of assets. Higher ratios indicate more efficient asset utilization.
They help understand asset utilization, facilitate industry comparisons, and enhance investment decision-making by indicating operational efficiency.
They can be overly reliant on historical data, insensitive to market conditions, and may lead to misinterpretation due to industry variations.
True Tamplin is a published author, public speaker, CEO of UpDigital, and founder of Finance Strategists.
True is a Certified Educator in Personal Finance (CEPF®), author of The Handy Financial Ratios Guide, a member of the Society for Advancing Business Editing and Writing, contributes to his financial education site, Finance Strategists, and has spoken to various financial communities such as the CFA Institute, as well as university students like his Alma mater, Biola University, where he received a bachelor of science in business and data analytics.
To learn more about True, visit his personal website or view his author profiles on Amazon, Nasdaq and Forbes.


