
The Upside Tasuki Gap is a concept known to those familiar with technical analysis and financial markets. It is a pattern observable in candlestick charting, frequently used in trading to predict price movements. This pattern signals the potential continuation of an existing uptrend, thus serving as a useful tool in a trader's arsenal. The Upside Tasuki Gap is based on observing three consecutive trading periods (days, hours, minutes, etc.), which take a particular form. This pattern includes two rising candlesticks separated by a gap, followed by a falling candlestick penetrating the gap between the first two. Understanding this concept necessitates a grasp of the dynamics of financial markets. It enables traders to make educated guesses about future market trends based on historical data. While not a foolproof method, it is an essential part of the decision-making process in trading. To identify an Upside Tasuki Gap, one must understand its construction. It is a three-candlestick pattern that takes shape under specific market conditions. The formation of an Upside Tasuki Gap begins with a bullish candlestick, marking an upward trend. This candlestick is characterized by a closing price higher than the opening price. The color of the candlestick body (the rectangle formed between the opening and closing prices) varies across different platforms. However, it is conventionally green or white. Following the first bullish candlestick, the second candlestick is also bullish. It must gap up from the first one, which means its opening price is higher than the closing price of the preceding candlestick. It suggests a strong buying pressure in the market, driving the price even higher. The third candlestick breaks the upward trend and is bearish. Its opening price is higher than the closing price of the second candlestick, but its closing price falls within the gap between the first two candlesticks. The bearishness indicates selling pressure in the market, but the fact that it does not completely fill the gap suggests a possible continuation of the uptrend. The Upside Tasuki Gap stands out due to its unique characteristics. The Upside Tasuki Gap can be identified by looking for its defining features: two consecutive bullish candlesticks separated by a gap, followed by a bearish candlestick that does not fill this gap. To the trained eye, this pattern is immediately noticeable. An often-overlooked aspect of the Upside Tasuki Gap is the trading volume during its formation. The high trading volume during the formation of the first two bullish candlesticks can reinforce the credibility of the uptrend. In contrast, low volume during the formation of the bearish candlestick suggests that the downward price movement might be temporary. The Upside Tasuki Gap provides valuable insights into potential market trends. It reflects the battle between buyers and sellers in the market and suggests the possibility of an uptrend continuation. The Upside Tasuki Gap primarily signals the continuation of an uptrend. The gap between the first two candlesticks represents strong bullish momentum. The bearish third candlestick, although breaking the upward trend, does not fully cover the gap, implying that selling pressure might not be strong enough to reverse the uptrend. The gap between the first and second candlesticks, as previously explained, demonstrates a robust buying interest in the market. This strong momentum is a positive sign for traders long on security. The third bearish candlestick is key to interpreting the Upside Tasuki Gap. It suggests a temporary pause in the buying spree. However, if the selling pressure were robust, the bearish candlestick would completely fill the gap. Therefore, the fact that it doesn't completely fill the gap suggests that the selling pressure might be temporary, indicating a possible continuation of the bullish trend. While the formation of an Upside Tasuki Gap can be a strong signal, traders often look for confirmation before making decisions. The fourth candlestick is crucial in confirming the Upside Tasuki Gap. If this candlestick is bullish and its closing price is higher than the closing price of the bearish third candlestick, it confirms the continuation of the uptrend. Besides the fourth candlestick, other technical indicators can be used to confirm the Upside Tasuki Gap. For instance, a rising Relative Strength Index (RSI) or Moving Average Convergence Divergence (MACD) can serve as additional confirmation signals. The Upside Tasuki Gap, when correctly identified and confirmed, can provide lucrative trading opportunities. The confirmation of an Upside Tasuki Gap presents a potential buying opportunity. Traders can enter a long position, anticipating a continuation of the uptrend. It's crucial to manage risk when trading based on the Upside Tasuki Gap. Traders often set stop-loss orders below the low of the third candlestick to protect themselves if the trend unexpectedly reverses. Understanding the potential risk and reward is fundamental in trading. If the confirmed Upside Tasuki Gap results in a continued uptrend, the potential reward could be substantial. However, traders should always be aware of the risk of trend reversal and act accordingly. As with any trading tool, the Upside Tasuki Gap has limitations and risks. The Upside Tasuki Gap can produce false signals, indicating an uptrend continuation when in fact, the trend may reverse. This risk underscores the importance of seeking confirmation signals and setting stop-loss orders. High market volatility can disrupt the formation of the Upside Tasuki Gap. Rapid and unpredictable price changes can distort the pattern, making it challenging to identify and interpret. To mitigate the risks associated with the Upside Tasuki Gap, traders often combine it with other analysis tools. Using the Upside Tasuki Gap with trend lines, support and resistance levels, and other technical indicators can provide a more holistic view of the market. The Upside Tasuki Gap is a bullish continuation pattern observed in candlestick charting. It consists of two rising candlesticks separated by a gap, followed by a falling candlestick that doesn't completely fill the gap. This pattern indicates the potential continuation of an uptrend. Traders look for high volume during the formation of the first two bullish candlesticks and confirmation from subsequent candlesticks or technical indicators. Trading strategies around the Upside Tasuki Gap include entering long positions and setting appropriate stop-loss points. However, false signals and market volatility can pose risks, emphasizing the need for confirmation signals and the use of other analysis tools. By understanding the formation and interpretation of the Upside Tasuki Gap, traders can gain insights into potential market trends and make informed trading decisions.What Is an Upside Tasuki Gap?
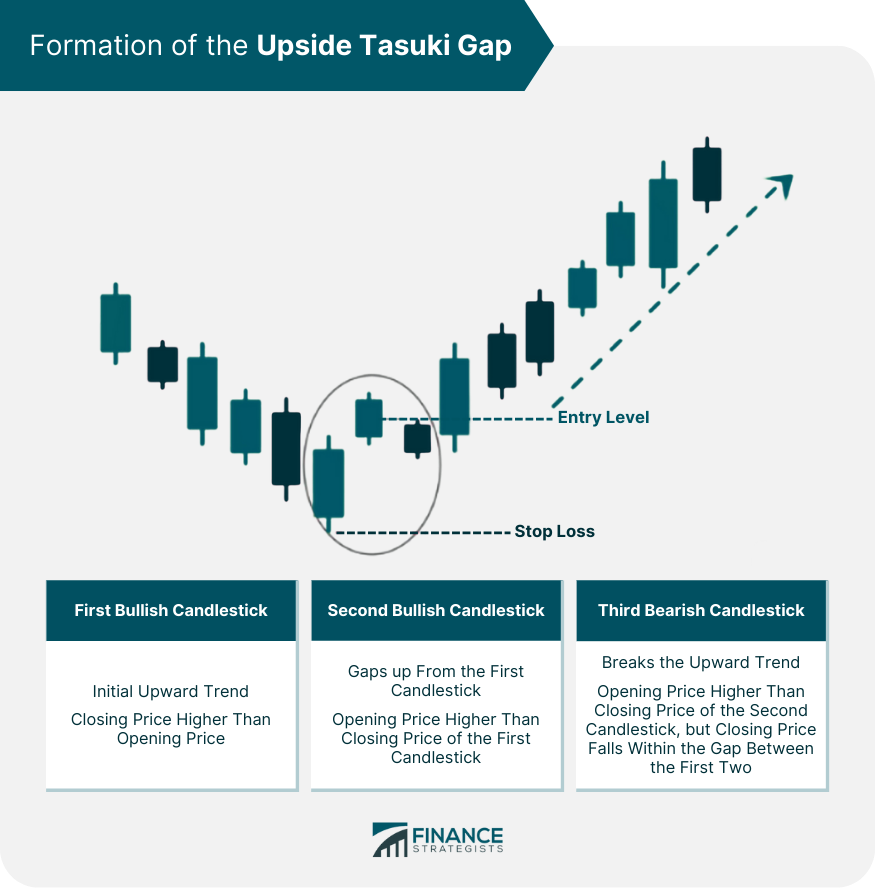
Formation of the Upside Tasuki Gap
First Bullish Candlestick
Second Bullish Candlestick
Third Bearish Candlestick
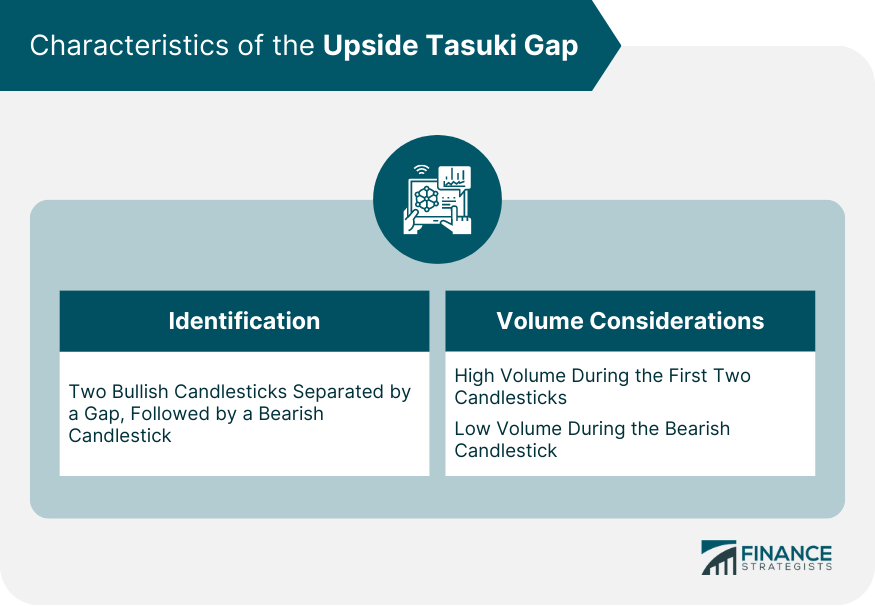
Characteristics of the Upside Tasuki Gap
Identification of the Upside Tasuki Gap
Volume Considerations During the Pattern Formation
Interpretation of the Upside Tasuki Gap
Signal of a Continuation in an Uptrend
Impact of the Gap Between the First and Second Candlesticks
Consideration of the Bearish Third Candlestick
Confirmation of the Upside Tasuki Gap
Importance of the Fourth Candlestick
Role of Other Technical Indicators in Confirming the Upside Tasuki Gap
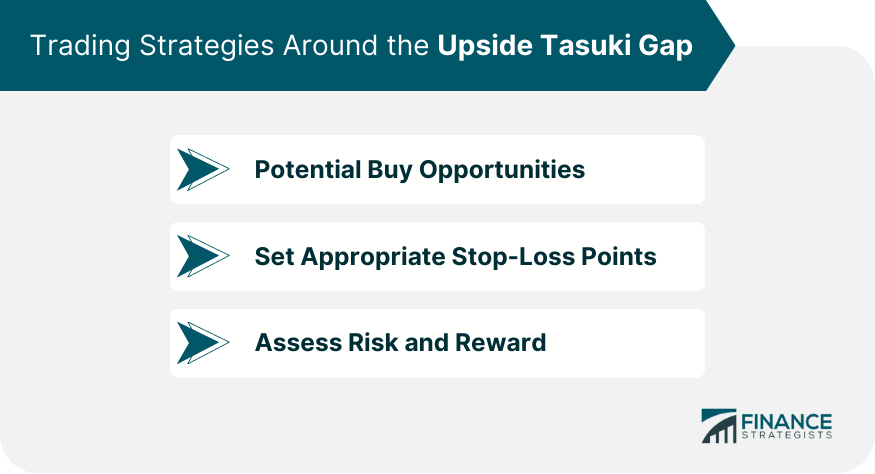
Trading Strategies Around the Upside Tasuki Gap
Potential Buying Opportunities
Setting Appropriate Stop-Loss Points
Assessing Risk and Reward
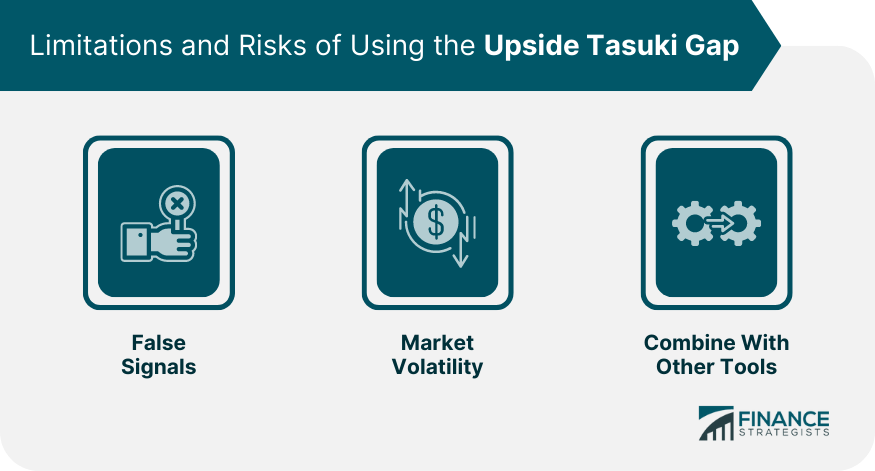
Limitations and Risks of Using the Upside Tasuki Gap
Possibility of False Signals
Role of Market Volatility in Disrupting the Pattern
Importance of Combining the Upside Tasuki Gap With Other Analysis Tools
Final Thoughts
Upside Tasuki Gap FAQs
An Upside Tasuki Gap is a bullish continuation pattern in technical analysis. It's formed by two consecutive bullish candlesticks with a gap in between, followed by a bearish candlestick that doesn't fully cover the gap. This pattern often indicates a continuation of an existing uptrend.
An Upside Tasuki Gap is typically confirmed by a fourth bullish candlestick that closes above the closing price of the third bearish candlestick. Additionally, other technical indicators, such as a rising relative strength index (RSI) or moving average convergence divergence (MACD), can be used to further confirm the pattern.
The Upside Tasuki Gap can offer potential buying opportunities. Once the pattern is confirmed, traders might enter a long position, anticipating a continuation of the uptrend. However, it's crucial to set appropriate stop-loss points, typically below the low of the third candlestick, to manage potential risks.
Like any technical analysis tool, the Upside Tasuki Gap comes with certain limitations and risks. It can produce false signals, suggesting a continuation of an uptrend when the trend might actually reverse. High market volatility can also disrupt the formation of the pattern. Therefore, it's essential to combine the Upside Tasuki Gap with other analysis tools for a more comprehensive market view.
The Upside Tasuki Gap differs from other bullish patterns primarily due to the presence of a gap between two bullish candlesticks, which is not commonly found in other patterns. The third bearish candlestick, which does not fill the gap, is also a distinguishing feature of the Upside Tasuki Gap.
True Tamplin is a published author, public speaker, CEO of UpDigital, and founder of Finance Strategists.
True is a Certified Educator in Personal Finance (CEPF®), author of The Handy Financial Ratios Guide, a member of the Society for Advancing Business Editing and Writing, contributes to his financial education site, Finance Strategists, and has spoken to various financial communities such as the CFA Institute, as well as university students like his Alma mater, Biola University, where he received a bachelor of science in business and data analytics.
To learn more about True, visit his personal website or view his author profiles on Amazon, Nasdaq and Forbes.


