
The "Tweezer" is a prominent pattern in technical analysis, primarily used in predicting potential price reversals in the financial markets. Made up of two candlesticks with matching highs or lows, the Tweezer pattern forms either a Tweezer Top (bearish reversal) or a Tweezer Bottom (bullish reversal). The purpose of this pattern is to help traders identify points where the market sentiment could change from bullish to bearish or vice versa. Understanding the Tweezer pattern is vital for traders as it can help them time their trades effectively and potentially increase profitability. Grasping this pattern's significance may enhance understanding of market dynamics, allowing for more informed investment decisions. The Tweezer pattern's relevance extends beyond individual investments, impacting broader market analysis and trading strategies and highlighting the importance of technical patterns in understanding market movements. The Tweezer Top is identified when the highs of two adjoining candlesticks are identical. This pattern indicates a strong resistance level, often suggesting that an uptrend may be reaching its peak and a bearish reversal could soon be on the horizon. Conversely, the Tweezer Bottom is recognized when the lows of two consecutive candlesticks are the same. This pattern points towards a strong support level, indicating that a downtrend may be nearing its end and a bullish reversal could be imminent. Tweezer patterns are critical tools in technical analysis. They help traders identify market trends and anticipate potential price reversals, providing the possibility of making profitable trades. Tweezer patterns can indicate the market's momentum. A Tweezer Top can signal that the buyers are losing control, and the sellers may be ready to take over, indicating a potential trend reversal from bullish to bearish. Conversely, a Tweezer Bottom suggests that the sellers are losing steam, and the buyers may be stepping in, implying a possible shift from bearish to bullish. A key feature of Tweezer patterns is their potential to forecast price reversals. A Tweezer Top, which emerges at the peak of an uptrend, suggests that the upward momentum is waning and a price drop may be imminent. Similarly, a Tweezer Bottom that surfaces at the end of a downtrend can indicate that the downward momentum is subsiding, and an upward price swing might be on the horizon. The Tweezer Top pattern forms when two consecutive candlesticks in an uptrend have the same high. The first candlestick in this pair is typically a strong bullish candle, followed by a candle of any color. The equal highs suggest that the buying pressure that has been pushing the price up may be exhausted, signaling a potential bearish reversal. A Tweezer Top pattern can be a bearish signal to traders, suggesting that the upward trend may have run its course. Traders might consider taking profits on long positions or potentially entering short positions when they spot this pattern. When trading a Tweezer Top, traders often set a sell order slightly below the low of the two-candlestick pattern. To manage risk, a stop loss can be set above the high of the pattern. If the price falls as anticipated, traders stand to make a profit. A Tweezer Bottom pattern is the opposite of the Tweezer Top. It forms when two consecutive candlesticks in a downtrend have the same low. The first candlestick is typically a strong bearish candle, followed by a candle of any color. The equal lows suggest that the selling pressure that has been pushing the price down may be depleted, indicating a potential bullish reversal. A Tweezer Bottom pattern can be a bullish signal to traders, indicating that the downward trend may be ending. Traders might consider taking profits on short positions or potentially entering long positions when they spot this pattern. When trading a Tweezer Bottom, traders often set a buy order slightly above the high of the two-candlestick pattern. To manage risk, a stop loss can be set below the low of the pattern. If the price rises as anticipated, traders stand to make a profit. Tweezer patterns can appear on any time frame chart. However, like all candlestick patterns, their predictive power increases with the time frame. Let's take a look at these patterns in daily, weekly, and monthly charts. On a daily chart, each candlestick represents a single day's trading activity. A Tweezer pattern on a daily chart can provide a short-term signal for traders. These patterns may form frequently but may also produce more false signals than those on longer time frames. On a weekly chart, each candlestick represents a week's worth of trading. A Tweezer pattern on a weekly chart provides a longer-term signal compared to a daily chart. These signals are less frequent but generally more reliable. On a monthly chart, each candlestick signifies a month's worth of trading. Tweezer patterns on monthly charts are quite rare but can signal significant long-term trend reversals. Despite their benefits, Tweezer patterns do have limitations. Like all trading indicators, they are not foolproof and should not be used in isolation. Tweezer patterns can sometimes produce false signals, suggesting a trend reversal that doesn't materialize. This limitation is especially prevalent in lower time frames, where price fluctuations are more frequent and random. To increase their reliability, Tweezer patterns should be used in conjunction with other technical indicators such as moving averages, RSI, or MACD. By doing so, traders can confirm signals and improve their trading accuracy. Tweezer patterns can be highly effective when combined with other trading strategies. They can complement candlestick patterns, trend lines, and moving averages, enhancing a trader's ability to make well-informed decisions. Tweezer patterns can be used alongside other candlestick patterns, like the Doji or Hammer, to reinforce signals. For instance, if a Tweezer Bottom pattern forms and the following candlestick is a bullish Hammer, this could provide a strong buy signal. Tweezer patterns can also be used with trendlines to identify potential reversal points. If a Tweezer pattern forms at a previously established trend line, it can provide a strong signal that the price is about to reverse in the opposite direction. Tweezer patterns can be used in conjunction with moving averages to confirm trend reversals. For example, if a Tweezer Bottom pattern forms and the price crosses above a moving average, it may signal a bullish reversal. The Tweezer pattern, a significant tool in technical analysis, is instrumental in predicting potential price reversals in the financial markets. By identifying Tweezer Tops and Bottoms, traders can gain insights into possible shifts in market sentiment, enhancing their trading strategy. Detailed analysis of these patterns, which include their structure, formation, and market implications, allows for strategic trading decisions. While they can provide false signals, integrating Tweezer patterns with other technical indicators, such as moving averages or trend lines, can increase their reliability. Moreover, their adaptability across different time frames, from daily to monthly charts, enhances their predictive power. Despite the rapid evolution of trading, including algorithmic and high-frequency trading, the relevance of Tweezer patterns remains undiminished. As they encapsulate fundamental market dynamics, their use continues to be a valuable tool in the trader's arsenal for making informed investment decisions.Overview of Tweezer
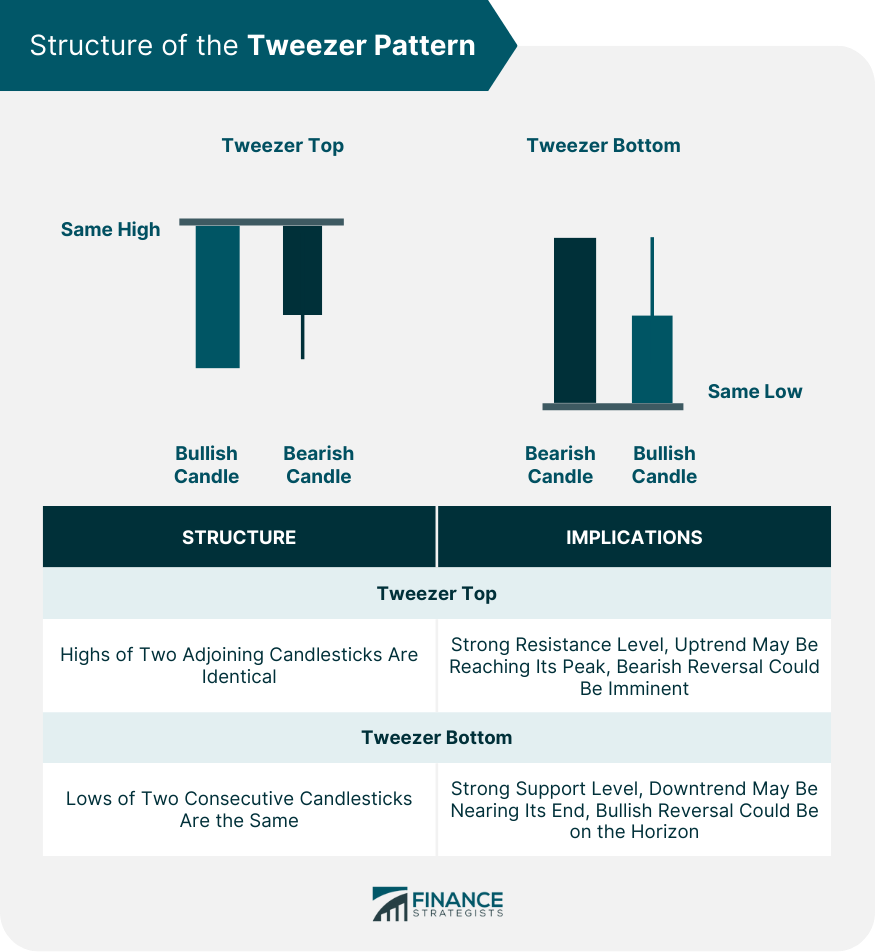
Structure of the Tweezer Pattern
Tweezer Top
Tweezer Bottom
Importance of Tweezer Patterns in Technical Analysis
Role of Tweezer Pattern in Identifying Market Trends
Relevance of Tweezer Patterns in Predicting Price Reversals
Detailed Analysis of Tweezer Patterns
Analysis of Tweezer Top Pattern
Structure and Formation
Market Implication
Trading Tweezer Top
Analysis of Tweezer Bottom Pattern
Structure and Formation
Market Implication
Trading Tweezer Bottom
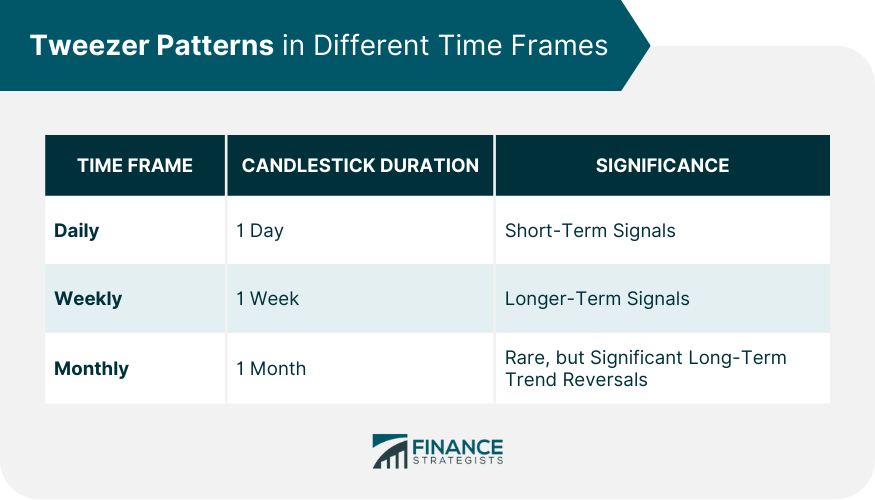
Tweezer Patterns in Different Time Frames
Daily Charts
Weekly Charts
Monthly Charts
Limitations of Tweezer Patterns
False Signals
Dependence on Other Technical Indicators
Integration of Tweezer Patterns With Other Trading Strategies
Combining Tweezer Patterns With Candlestick Patterns
Using Tweezer Patterns With Trend Lines
Tweezer Patterns and Moving Averages
Final Thoughts
Tweezer FAQs
Tweezer patterns are technical patterns used in financial trading to predict potential market reversals. They consist of two consecutive candlesticks with equal highs (Tweezer Top) or equal lows (Tweezer Bottom).
A Tweezer Top pattern, formed when two consecutive candlesticks have the same high point, typically occurs after an uptrend. It signifies a potential bearish reversal, suggesting that the buying pressure might be weakening.
A Tweezer Bottom pattern occurs when two consecutive candlesticks have the same low point. This pattern usually forms after a downtrend and signals a potential bullish reversal, indicating that selling pressure might be diminishing.
Tweezer patterns can appear on any time frame chart - daily, weekly, or monthly. Their predictive power increases with the time frame, with those on longer time frames being more reliable.
While Tweezer patterns can be beneficial, they also have limitations. They can sometimes produce false signals, suggesting a trend reversal that doesn't occur. Additionally, their effectiveness increases when used in conjunction with other technical indicators.
True Tamplin is a published author, public speaker, CEO of UpDigital, and founder of Finance Strategists.
True is a Certified Educator in Personal Finance (CEPF®), author of The Handy Financial Ratios Guide, a member of the Society for Advancing Business Editing and Writing, contributes to his financial education site, Finance Strategists, and has spoken to various financial communities such as the CFA Institute, as well as university students like his Alma mater, Biola University, where he received a bachelor of science in business and data analytics.
To learn more about True, visit his personal website or view his author profiles on Amazon, Nasdaq and Forbes.


