
A Doji is a term derived from the world of Japanese candlestick charts, representing a significant tool in technical analysis of financial markets. Specifically, a Doji forms when the opening and closing prices of a financial instrument—like a stock, a bond, or a currency pair—during a specific period are virtually the same. This creates a cross, inverted cross, or plus sign in the candlestick chart due to the narrow range between the opening and closing prices. The Doji is particularly important in technical analysis as it can often signal a potential reversal in the market. Traders and investors interpret the formation of a Doji as a sign of market indecision, where neither the buyers nor the sellers have gained control during the specified period. In the tug of war between buyers and sellers, the Doji illustrates a moment of balance or hesitation, potentially heralding a change in the trend. In order to comprehend the formation of a Doji, it's crucial to first understand the anatomy of a candlestick. Each candlestick represents a specified time period and consists of four main components: the opening price, the closing price, the high of the period, and the low of the period. The body of the candlestick is formed by the range between the opening and closing prices, while the lines, or wicks, that protrude from the body represent the high and low prices during the period. A Doji forms under specific market conditions. Essentially, it's created when the opening and closing prices are nearly identical, leading to a very small or nonexistent body. The lengths of the wicks can vary, and they reflect the volatility of the market during the period. A Doji is not a common occurrence and its formation is a noteworthy event for traders, as it can signify potential nonexistent body movement. The Basic Doji, sometimes referred to as a "Neutral Doji," is represented by a plus sign (+) on the candlestick chart. This occurs when the opening, closing, high, and low prices are all different, with a virtually non-existent body and comparable upper and lower wicks. A Long-Legged Doji showcases more significant price movement above and below the opening and closing prices, resulting in longer wicks. This candlestick pattern signals a higher degree of indecision as prices swung considerably high and low within the period, but ended nearly unchanged. A Dragonfly Doji is characterized by a long lower wick and no upper wick. This indicates that sellers controlled the market for most of the period, driving prices down, but by the end, buyers pushed prices back up to the opening level. The opposite of a Dragonfly, a Gravestone Doji has a long upper wick and no lower wick. This shows buyers controlled the market initially, but by the end of the period, sellers pushed the price back to the opening level. A Doji's primary value comes from its ability to clearly indicate market indecision. The thin body demonstrates that there is no clear victor between buyers and sellers for the period, creating a stalemate. This equilibrium can precede a significant price move, especially if the Doji appears after a prolonged trend. The Doji's location within a price trend can enhance its significance. For instance, a Doji that appears in an uptrend may indicate that the buying pressure is subsiding and a bearish reversal might be forthcoming. Conversely, a Doji appearing in a downtrend could signal that selling pressure is decreasing, hinting at a possible bullish reversal. A Doji occurring in an uptrend can suggest the trend may be losing steam. It may indicate that buyers are no longer as enthusiastic to continue pushing the price higher, and sellers are starting to fight back. This can be the first sign of a potential trend reversal. Similarly, a Doji appearing during a downtrend may signal the sellers are losing their control and buyers are beginning to step in. This can imply a possible reversal to the upside is on the horizon. While a Doji can signal a potential reversal, it's essential to await confirmation in subsequent periods before making a trading decision. A Doji provides a signal, but the real confirmation of the trend change comes with the next candlestick or sequence of candlesticks. A Doji Star occurs when a Doji forms after a long-bodied candlestick. It suggests that the preceding trend might be about to reverse, with the Doji Star representing a period of indecision. An Evening Doji Star is a three-candle pattern where a long bullish candle is followed by a Doji, which gaps above the close of the first candle. The third candle is a long bearish candle that closes below the midpoint of the first candle. This pattern often signals a potential bearish reversal. The Morning Doji Star is the mirror image of the Evening Doji Star. It consists of a long bearish candle, followed by a Doji that gaps below the first candle's close, and finally a long bullish candle that closes above the midpoint of the first candle, signaling a potential bullish reversal. The Harami pattern consists of a large candle followed by a smaller candle (including a Doji) that is completely within the range of the first candle. When the second candle is a Doji, it could potentially signal a strong reversal, as the Doji shows even greater indecision. While Doji patterns can be valuable indicators of potential market reversals, they are not infallible. A Doji indicates a possible reversal, but it does not guarantee it. Market factors and subsequent price action may not follow the signal provided by the Doji. In the unpredictable world of trading, risk management is vital. When trading based on Doji signals, it's important to use stop-loss orders and risk-reward ratios to manage potential losses. It is crucial to note that waiting for confirmation after a Doji can often increase the likelihood of making a successful trade. The Doji candlestick pattern is a valuable tool in technical analysis that indicates market indecision and potential reversals. Its formation, characterized by a narrow range between opening and closing prices, signifies a moment of balance and hesitation between buyers and sellers. Traders interpret the Doji's appearance within a trend as a signal of a possible trend reversal, depending on its location and confirmation from subsequent price action. However, it is important to understand the limitations of Doji signals. While they can provide valuable insights, they are not foolproof indicators, and market factors may not align with the suggested reversal. Traders should implement risk management strategies, such as using stop-loss orders and considering risk-reward ratios, to mitigate potential losses. Additionally, waiting for confirmation after a Doji can enhance the probability of making successful trades. By understanding the nuances of Doji patterns and applying prudent risk management, traders can effectively incorporate this candlestick formation into their analysis and risk-reward ratios.What Is a Doji?
Formation of a Doji
Candlestick Anatomy
Conditions Leading to the Formation
Types of Doji
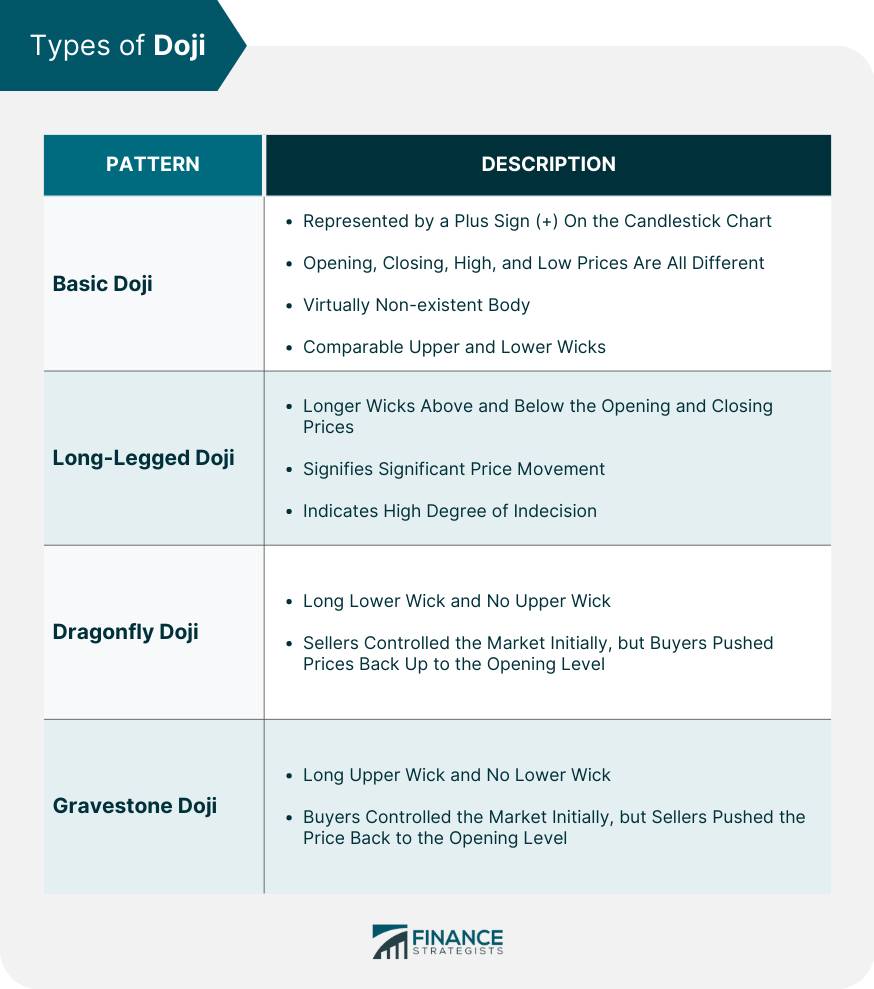
Basic Doji
Long-Legged Doji
Dragonfly Doji
Gravestone Doji
Doji as a Market Indicator
Indication of Market Indecision
Significance of Location in a Trend
Interpreting Doji Signals
Doji in an Uptrend
Doji in a Downtrend
Importance of Confirmation Following a Doji
Doji and Other Candlestick Patterns
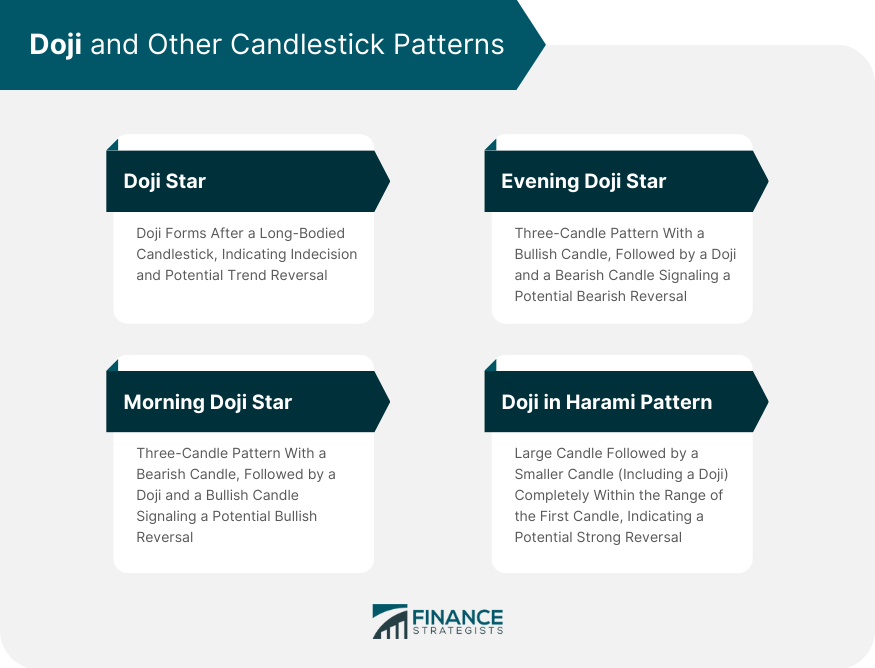
Doji Star
Evening Doji Star
Morning Doji Star
Doji in Harami Pattern
Doji Limitations and Risks
Understanding the Limitations of Doji Signals
Managing Risks Associated With Doji
Final Thoughts
Doji FAQs
A Doji pattern holds significance in technical analysis as it indicates market indecision and potential reversals. It represents a balance between buyers and sellers, suggesting that neither party has gained control during the specified period. This can be a signal for traders to anticipate a potential change in the prevailing trend.
When a Doji pattern appears in an uptrend, it suggests that the buying pressure may be weakening, and a bearish reversal could be on the horizon. It indicates that buyers are becoming less enthusiastic about pushing the price higher, potentially signaling a trend reversal.
Yes, a Doji pattern can also signal a reversal in a downtrend. It may indicate that selling pressure is subsiding, and buyers are starting to enter the market. This can suggest a possible bullish reversal in the near future.
Risk management is crucial when trading based on Doji patterns. Traders should consider using stop-loss orders to limit potential losses if the market does not follow the anticipated reversal. Additionally, implementing proper risk-reward ratios can help maintain a balanced approach and protect against significant losses.
Yes, confirmation is essential after observing a Doji pattern. While the pattern provides a signal of potential reversal, traders should wait for subsequent price action to confirm the trend change. This confirmation can come in the form of the next candlestick or a sequence of candlesticks, providing more reliable indications of market direction.
True Tamplin is a published author, public speaker, CEO of UpDigital, and founder of Finance Strategists.
True is a Certified Educator in Personal Finance (CEPF®), author of The Handy Financial Ratios Guide, a member of the Society for Advancing Business Editing and Writing, contributes to his financial education site, Finance Strategists, and has spoken to various financial communities such as the CFA Institute, as well as university students like his Alma mater, Biola University, where he received a bachelor of science in business and data analytics.
To learn more about True, visit his personal website or view his author profiles on Amazon, Nasdaq and Forbes.


