
The High-Low Index is a technical analysis tool used to track market momentum and provide insights into overall market trends. Calculated using new 52-week highs and lows, this breadth indicator provides a percentage value representing the market's underlying strength or weakness. Unlike price-based indicators, it considers the totality of market securities, offering a comprehensive view of market health. The Index allows traders and investors to gauge market participation in various trends, aiding their decision-making process. It's instrumental in identifying potential trend reversals, market tops, and bottoms and confirming ongoing trends. Additionally, it can highlight divergence, and discrepancies between market prices and the index, often signaling potential market reversals. To comprehend the High-Low Index, one must first understand its two essential components: New Highs and New Lows. The first major component of the High-Low Index is New Highs. New Highs in the context of the stock market refer to the total number of individual stocks that have reached their highest price level in the last 52 weeks on a particular trading day. This is an essential indicator as it signifies a potential upward trend in the market or a specific stock. When a stock reaches a new 52-week high, it could be an indication that the company is performing exceptionally well. It could be due to positive company-specific factors such as robust earnings, the launch of a successful new product, or the announcement of a significant strategic move. Alternatively, it could also be due to bullish market conditions, encouraging investors to bid up the price of stocks in general. New Highs are calculated by tracking the number of stocks that have hit their highest price in the last 52 weeks on each trading day. Analysts keep a running tally of these numbers to monitor market trends and gauge the market's overall bullishness or bearishness. The second crucial component of the High-Low Index is New Lows. New Lows represent the total number of stocks reaching their lowest price level in the past 52 weeks on a given trading day. If a stock reaches a new 52-week low, it could be an indication of a potential downward trend in that stock or the market in general. It might signal negative company-specific news like disappointing earnings results, a failed product, or a harmful strategic decision. Besides, broad market conditions could also be bearish, leading to a widespread sell-off of stocks. Similar to New Highs, New Lows are calculated by keeping a record of the number of stocks reaching their lowest price level in the past 52 weeks each trading day. This data helps analysts determine the overall sentiment in the market, offering insights into potential bearish trends. Both the New Highs and New Lows are crucial in computing the High-Low Index. Each contributes unique information about market performance. An abundance of New Highs signals a bullish market, while a surge in New Lows suggests a bearish market. By comparing these two components, the High-Low Index helps traders understand the market's overall direction. Computing the High-Low Index involves several steps. 1. Determine the number of New Highs and New Lows for the day. 2. Subtract the number of New Lows from the number of New Highs. 3. Divide this difference by the sum of New Highs and New Lows, then multiply by 100 to get the percentage value. Mathematically, the High-Low Index can be calculated using the following formula: This formula simply illustrates how the disparity between New Highs and New Lows is divided by their total, providing a percentage value that indicates the strength of market momentum. Accurate computation of the High-Low Index is vital in understanding market trends. Errors could lead to misinterpretation of market direction, potentially resulting in misguided trading decisions. Thus, careful attention to detail is required when calculating the High-Low Index. When interpreting the High-Low Index, understanding the significance of its values is key. Here are some guidelines for how to interpret these data points: Typically, a High-Low Index value above 50% is considered bullish. This means that more securities are reaching new highs than those hitting new lows. It signifies a strong buying pressure in the market, indicating a generally upward movement of stock prices and optimistic investor sentiment. In such a scenario, traders might choose to go long or buy more shares, betting on the continuing rise of the market. Conversely, a High-Low Index value below 50% is seen as bearish. This suggests that more securities are hitting new lows than reaching new highs. This is often indicative of selling pressure in the market and a pessimistic sentiment among investors. During such a phase, traders might choose to sell or go short, expecting further price drops. The High-Low Index can also be used to identify overbought or oversold conditions in the market. Extreme values, either very high or very low, may signal these conditions. For instance, an unusually high value, say above 80%, may suggest an overbought condition, implying the prices are excessively high and could be due for a pullback or reversal. On the other hand, a value significantly below 20% might indicate an oversold condition, signifying the prices are too low and could be due for a bounce or upward correction. Remember, like any other technical analysis tool, the High-Low Index should not be used in isolation. Combining it with other indicators and tools can give a more comprehensive and accurate understanding of the market's direction and sentiment. Also, while the Index provides a broad overview of the market's direction, individual stock performance can vary. Thus, traders should also consider the specific fundamentals of the securities they are interested in. As a market breadth indicator, the High-Low Index is crucial in providing an overall sentiment of the market. A rising High-Low Index indicates a bullish market sentiment, as more securities are reaching new highs than lows. Conversely, a falling High-Low Index suggests bearish sentiment, with more securities touching new lows. The High-Low Index can influence market sentiment by offering a clear view of the market's breadth. Extreme values can trigger shifts in sentiment, as they may signal overbought or oversold market conditions, potentially leading to a trend reversal. Therefore, traders and investors often consider the High-Low Index when forming their market outlook. Despite its usefulness, the High-Low Index has its limitations. It's heavily dependent on market conditions; thus, during times of low volatility or consolidation, it might provide little to no meaningful information. Additionally, it does not consider the size or market capitalization of the companies reaching new highs or lows, which could skew the index readings. A common criticism is that the High-Low Index can generate false signals, particularly during volatile market conditions. Some may also misconstrue the index readings, equating a high index value with an overbought market and vice versa, which is not always the case. Understanding the nuances of interpreting the High-Low Index is crucial to avoid such pitfalls. While the High-Low Index offers valuable market insights, it's beneficial to use it in conjunction with other market indicators, such as the Relative Strength Index (RSI), Moving Averages, or the Advance-Decline Line, for a more holistic view of the market. Traders should consider the High-Low Index as part of their broader analytical toolkit. The index can be used to validate other technical indicators, confirm a market trend, or identify potential reversal points. However, decisions should not be based on the High-Low Index alone. In trading strategies, the High-Low Index can serve as a trend confirmation tool, risk management aid, or signal generator for entry or exit points. Traders can tailor their strategies around the index, increasing or decreasing their market exposure based on its readings. The High-Low Index can help traders manage risk by signaling potential trend reversals. If the index begins to decline amid a bullish trend, traders may opt to reduce their long positions to mitigate potential losses. The High-Low Index is a compelling market breadth indicator that computes the momentum of the market by comparing the number of securities hitting new 52-week highs and lows. Its calculation, which involves subtracting the number of new lows from new highs, dividing this difference by the sum of new highs and new lows, and multiplying the result by 100, provides a percentage value that indicates the direction and strength of the market's momentum. Understanding how to interpret this value is essential to make informed trading decisions. A High-Low Index value above 50% often signifies a bullish market sentiment, while a value below 50% is usually indicative of bearish sentiment. However, it is crucial to note that extreme values may signal overbought or oversold market conditions, suggesting a potential trend reversal. Remember, while the High-Low Index is a potent tool for gauging market momentum, it should be used in conjunction with other indicators for a more comprehensive market analysis. As you navigate the complex world of financial markets, don't hesitate to seek professional wealth management services, which can offer expert guidance and help optimize your investment strategies for optimal returns.What Is a High-Low Index?
Understanding the High-Low Index Components
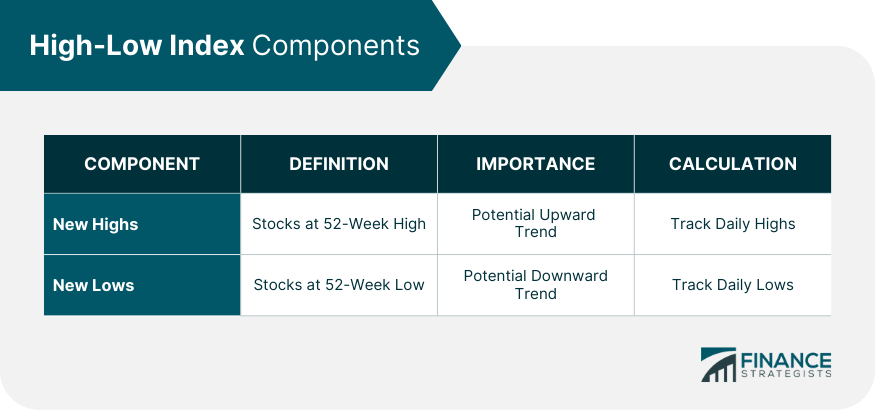
Component 1: New Highs
Importance of New Highs
Calculation of New Highs
Component 2: New Lows
Importance of New Lows
Calculation of New Lows
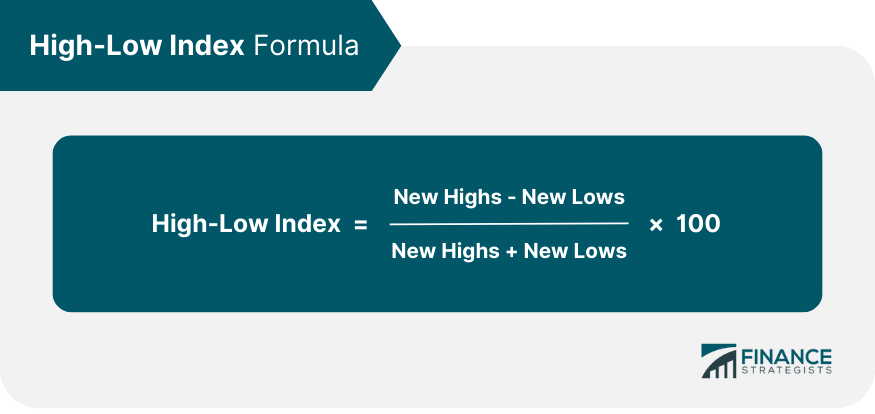
Calculation of the High-Low Index
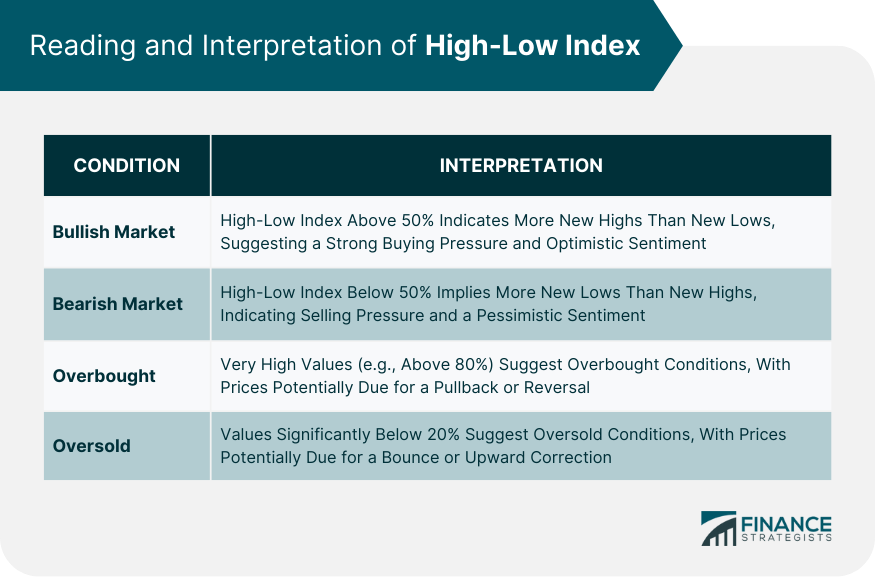
Reading and Interpretation of High-Low Index
Bullish Market Conditions
Bearish Market Conditions
Overbought or Oversold Market Conditions
High-Low Index as a Market Indicator
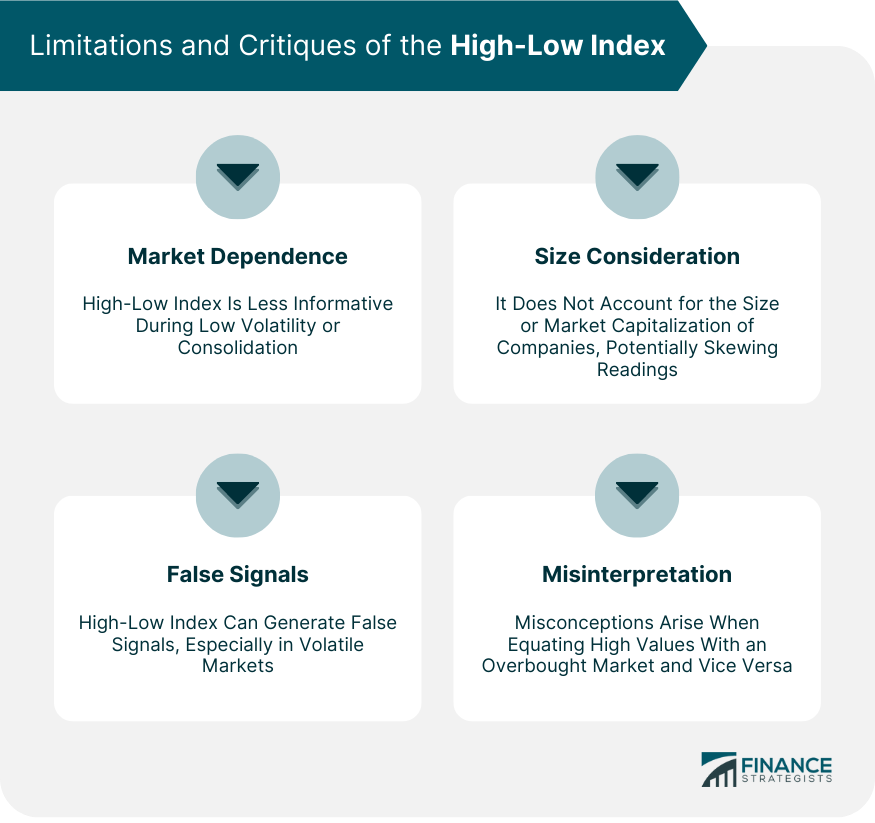
Limitations and Critiques of the High-Low Index
Analysis of the Limitations and Potential Flaws of the High-Low Index
Understanding the Criticisms and Common Misconceptions About the High-Low Index
Consideration of Alternative Market Indicators for Comparison
Practical Application of High-Low Index in Trading
Final Thoughts
High-Low Index FAQs
The High-Low Index is a technical analysis tool that tracks the momentum of the market by comparing the number of securities reaching new 52-week highs and lows.
The High-Low Index is calculated by subtracting the number of New Lows from New Highs, dividing this by the sum of New Highs and New Lows, and then multiplying by 100.
The High-Low Index can help inform trading decisions by indicating the overall market sentiment and potential trend reversals.
The High-Low Index doesn't consider the size or market capitalization of companies reaching new highs or lows and may provide little insight during periods of low volatility or market consolidation.
Yes, the High-Low Index can be applied across various financial markets, including stocks, commodities, and futures.
True Tamplin is a published author, public speaker, CEO of UpDigital, and founder of Finance Strategists.
True is a Certified Educator in Personal Finance (CEPF®), author of The Handy Financial Ratios Guide, a member of the Society for Advancing Business Editing and Writing, contributes to his financial education site, Finance Strategists, and has spoken to various financial communities such as the CFA Institute, as well as university students like his Alma mater, Biola University, where he received a bachelor of science in business and data analytics.
To learn more about True, visit his personal website or view his author profiles on Amazon, Nasdaq and Forbes.


