
The Herrick Payoff Index (HPI) is a financial indicator used in wealth management to assess market trends and evaluate the potential profitability of investments. It is a composite index that takes into account price, volume, and open interest data to provide insights into market sentiment and the strength of buying or selling pressure. The HPI is designed to help investors and traders make informed decisions by identifying potential turning points in the market. Traders and analysts use the HPI to make informed decisions regarding market entry or exit points and to gauge the overall market sentiment. The HPI holds significant importance in wealth management as it provides a comprehensive view of market dynamics and helps investors identify potential opportunities and risks. By examining the relationship between price movements, trading volume, and open interest, the HPI offers insights into market sentiment, strength of trends, and potential changes in market direction. Wealth managers utilize the HPI to assess the risk associated with specific investments, evaluate the effectiveness of different trading strategies, and identify potential market trends. This information allows them to make informed investment decisions, allocate capital effectively, and manage risk in client portfolios. Additionally, the HPI can be used in conjunction with other financial indicators to enhance the accuracy of market analysis and decision-making processes. The Herrick Payoff Index was developed by John Herrick in the 1970s as a tool to analyze market trends and identify potential turning points. Herrick, a prominent trader and analyst, recognized the need for a comprehensive indicator that would capture both price and volume dynamics in the market. Inspired by the work of other technical analysts, Herrick combined price data, trading volume, and open interest to create the HPI. He believed that by integrating these key factors, he could provide a more accurate assessment of market sentiment and forecast future price movements. Over the years, the HPI has gained popularity and recognition among traders and wealth managers. Its effectiveness in identifying market trends and signaling potential reversals has made it a valuable tool in financial analysis. The work of notable technical analysts, such as Linda Bradford Raschke and Larry Connors, has further contributed to the understanding and application of the HPI. These experts have emphasized the importance of incorporating volume and open interest data into market analysis, and they have provided insights into effective ways of using the HPI in trading strategies. The HPI's development and evolution have been shaped by the contributions of various market participants and analysts, making it a well-established and respected indicator in wealth management circles. The Herrick Payoff Index (HPI) is calculated using a combination of price, volume, and open interest data. The formula for calculating the HPI is not standardized and may vary slightly depending on the software or platform used. However, the general principle involves assigning weights to these variables and aggregating them to generate the index. The specific weights assigned to price, volume, and open interest may be adjusted based on the desired sensitivity and responsiveness of the HPI. Typically, price changes, especially larger moves, have a higher weight, while volume and open interest changes are given lesser weights. The weighted values are then combined and plotted on a chart to create the HPI line. The Herrick Payoff Index takes into account several key factors and variables in its calculation. These factors include: Changes in price are a critical component of the HPI calculation. Larger price moves, especially in the direction of the prevailing trend, have a more significant impact on the index. Trading volume reflects the level of market participation and is an important measure of market activity. Higher volume during price movements is generally associated with stronger buying or selling pressure, influencing the HPI. Open interest represents the number of outstanding contracts in the futures or options market. Changes in open interest can indicate the entry or exit of market participants, suggesting shifts in market sentiment and potential trend reversals. By incorporating these variables, the HPI aims to capture the interplay between price movements, volume, and open interest to provide insights into market dynamics and sentiment. The interpretation of Herrick Payoff Index (HPI) values can vary depending on the individual's trading or investment approach. Generally, a positive HPI value indicates buying pressure and suggests a bullish market sentiment, while a negative HPI value suggests selling pressure and a bearish sentiment. Traders and investors often focus on the magnitude and direction of the HPI line to identify potential turning points in the market. Peaks or troughs in the HPI line can signal market tops or bottoms, indicating potential reversals in the prevailing trend. It's important to note that the HPI is typically used in conjunction with other technical analysis tools and indicators to confirm signals and enhance decision-making. Traders and wealth managers often combine the HPI with chart patterns, trend lines, and oscillators to form a comprehensive analysis of the market before making trading or investment decisions. The Herrick Payoff Index (HPI) can be a valuable tool for risk assessment and analysis in wealth management. By examining the HPI values, wealth managers can assess the level of buying or selling pressure in the market, providing insights into potential market reversals or shifts in sentiment. Wealth managers can use the HPI to identify periods of heightened risk or potential market volatility. For example, a significant divergence between price and HPI may indicate a potential market correction or reversal, alerting wealth managers to exercise caution or implement risk management strategies. The HPI can be instrumental in evaluating the effectiveness of investment strategies. Wealth managers can use the HPI to assess the performance of specific investment approaches, such as trend following or mean reversion strategies. By analyzing the HPI in conjunction with other technical indicators or trading rules, wealth managers can identify the suitability of investment strategies in different market conditions. The HPI can provide valuable insights into the strength and sustainability of market trends, helping wealth managers make informed decisions regarding entry or exit points for their investment strategies. The Herrick Payoff Index is a useful tool for identifying market trends and generating trading signals. It helps wealth managers detect changes in market sentiment and identify potential turning points. By analyzing the HPI, wealth managers can identify periods of increasing buying or selling pressure, which may signal the emergence of a new trend or the potential exhaustion of an existing trend. This information can guide wealth managers in making timely investment decisions and capturing opportunities in the market. Wealth managers often utilize multiple financial indicators to gain a comprehensive view of market conditions. The Herrick Payoff Index can be effectively used in conjunction with other indicators to validate signals and enhance decision-making. For example, wealth managers may compare the HPI with other technical indicators such as moving averages, oscillators, or trend lines. When these indicators align or confirm the signals generated by the HPI, it can increase the confidence in the analysis and provide stronger conviction in making investment decisions. By integrating the HPI with other financial indicators, wealth managers can enhance their understanding of market dynamics and improve the accuracy of their investment strategies. Like any financial indicator, the Herrick Payoff Index (HPI) is not without limitations. One potential criticism is the inherent subjectivity in assigning weights to the variables used in the calculation. The weighting methodology may introduce biases and affect the accuracy of the index. Furthermore, the HPI relies on historical price, volume, and open interest data. Any inaccuracies or errors in the underlying data can impact the reliability and effectiveness of the HPI. It is essential for wealth managers to ensure the accuracy and integrity of the data used in the calculation of the HPI. The HPI is based on historical price, volume, and open interest data, which means it may not capture real-time market developments or sudden changes in market sentiment. It relies on past trends and patterns to generate insights about future market movements. As a result, the HPI may have limited effectiveness during periods of significant market volatility or when there are sudden shifts in market dynamics. It is crucial for wealth managers to consider current market conditions and incorporate real-time data alongside the HPI to make well-informed investment decisions. The HPI's effectiveness can vary depending on the market conditions and asset classes being analyzed. Certain markets or asset classes may exhibit characteristics that are not well-captured by the HPI methodology, limiting its applicability. Wealth managers need to be aware that the HPI may perform differently in different market environments. It is important to consider the specific characteristics of the asset being analyzed and to use the HPI in conjunction with other relevant indicators and tools. Additionally, the HPI is primarily designed for short to medium-term analysis and may not be suitable for long-term investors or those with a buy-and-hold investment approach. Its focus on capturing short-term market sentiment and potential reversals makes it more applicable for traders and active investors. The Herrick Payoff Index (HPI) is a financial indicator that combines price, volume, and open interest data to provide insights into market sentiment, trends, and potential reversals. It finds applications in risk assessment, evaluation of investment strategies, identification of market trends, and comparison with other financial indicators. While the HPI has proven to be a valuable tool in wealth management, it is essential to recognize its limitations. The subjectivity in assigning weights, reliance on historical data, and its applicability in different market conditions are factors that need to be carefully considered. The HPI should be used as part of a comprehensive analysis, combining various indicators and market research to make informed investment decisions. Wealth managers should adapt their approach based on current market conditions.What Is the Herrick Payoff Index (HPI)?
Purpose and Significance of HPI
Historical Background of the Herrick Payoff Index
Development and Origin
Key Contributors and Influencers
Calculation Methodology
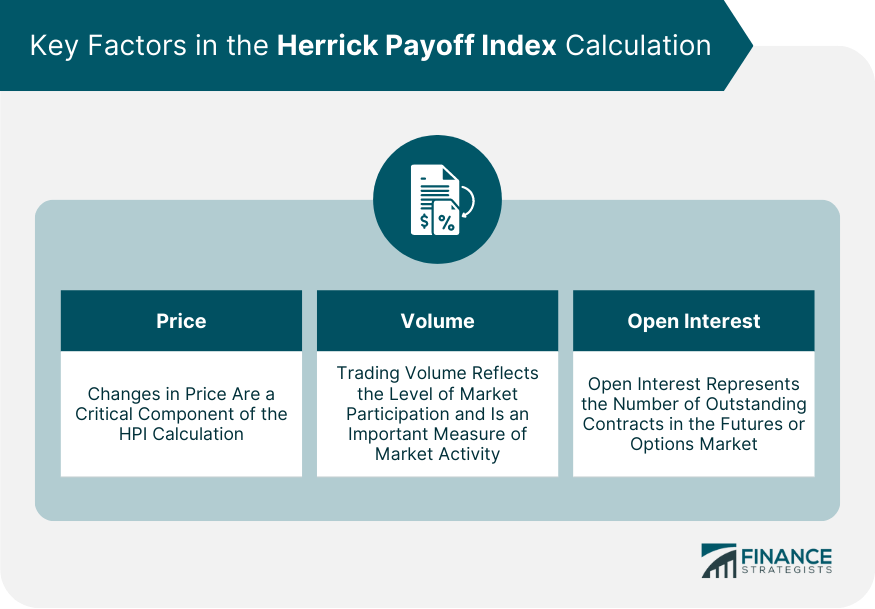
Key Factors and Variables Considered in the Calculation
Price
Volume
Open Interest
Interpretation of HPI Values
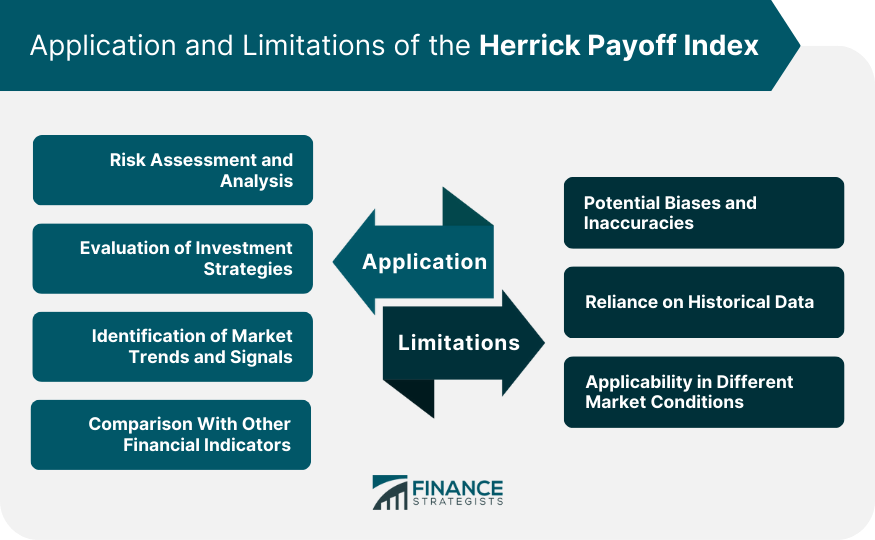
Application of HPI in Wealth Management
Risk Assessment and Analysis
Evaluation of Investment Strategies
Identification of Market Trends and Signals
Comparison With Other Financial Indicators
Limitations and Criticisms of the Herrick Payoff Index
Potential Biases and Inaccuracies
Reliance on Historical Data
Applicability in Different Market Conditions
Final Thoughts
Herrick Payoff Index FAQs
The Herrick Payoff Index (HPI) is a financial indicator used in wealth management to assess risk, evaluate investment strategies, and identify market trends.
The Herrick Payoff Index is calculated using a specific methodology that incorporates various factors and variables, such as price changes and volume data, to derive a numerical value.
The HPI is applied in wealth management for risk assessment, investment strategy evaluation, and identification of market trends and signals to make informed financial decisions.
The HPI has limitations, including potential biases and inaccuracies, reliance on historical data, and its applicability under different market conditions.
Yes, the Herrick Payoff Index can be used in conjunction with other financial indicators to gain a more comprehensive understanding of market dynamics and make well-rounded investment decisions.
True Tamplin is a published author, public speaker, CEO of UpDigital, and founder of Finance Strategists.
True is a Certified Educator in Personal Finance (CEPF®), author of The Handy Financial Ratios Guide, a member of the Society for Advancing Business Editing and Writing, contributes to his financial education site, Finance Strategists, and has spoken to various financial communities such as the CFA Institute, as well as university students like his Alma mater, Biola University, where he received a bachelor of science in business and data analytics.
To learn more about True, visit his personal website or view his author profiles on Amazon, Nasdaq and Forbes.


