
A double top is a common bearish reversal chart pattern used in technical analysis. It visually represents a period in the market where the price hits a certain high twice, but fails to break through this resistance level. Between these two peaks, the price declines, which creates a support level or "neckline". This pattern visually resembles the letter 'M'. The double top plays a significant role in technical analysis. It can indicate a potential shift in trend from bullish (rising) to bearish (falling), enabling traders to anticipate potential market downturns. The appearance of a double top often reflects weakening in the strength of the bull market, suggesting that bears are gaining control. Consequently, it can provide an opportunity to exit long positions or enter short positions. While most prevalent in the stock market, the double top pattern can be found across various financial markets, including commodities, foreign exchange (forex), indices, and even cryptocurrencies. The reliability of this pattern holds regardless of the market, illustrating its robustness and importance in trading. A double top is formed over five stages: Identifying a valid double top involves several crucial elements. The two peaks should be roughly at the same price level, and there should be a noticeable decline between the peaks forming the "neckline". The volume often decreases during the second peak formation, indicating a reduction in momentum. The pattern is confirmed when the price breaks down through the neckline on increased volume. The timeframe for a double top formation can range from several weeks to many months and can occur in any time frame, such as daily, weekly, or monthly charts. The length of formation influences the duration of the subsequent bearish trend – the longer the pattern takes to form, the longer the expected price decline. The double top pattern is a manifestation of the psychological decision-making process of traders. The first peak represents a high point where sellers outweigh buyers, leading to a price decline. When the price rallies again, buyers attempt to push past the previous high. Failing to do so indicates decreased bullish sentiment, giving the sellers an upper hand, leading to the price falling and creating the second peak. The double top is closely related to investor sentiment. It's a visual representation of a power shift from buyers to sellers. The inability to break past the previous high during the second peak signifies weakening bullish sentiment. The pattern's completion, indicated by a neckline break, often leads to an increase in bearish sentiment and selling activity. Successful trading of the double top pattern involves three main steps: Like all trading strategies, the double top pattern comes with its risks and limitations. For instance, sometimes the price may retest the neckline after the initial breakdown, leading to potential losses for short traders. Moreover, the pattern might not always be correctly identified or completed, resulting in false signals. Double Bottom is the bullish counterpart of Double Top. It consists of two consecutive troughs of similar depth, separated by a peak or a "neckline" in between. When the price breaks above the neckline, it is considered a bullish signal indicating a potential upward trend reversal. While Double Top indicates a potential bearish reversal, Double Bottom indicates a potential bullish reversal. Head and Shoulders is another reversal pattern that consists of three consecutive peaks and troughs. It has a central peak, called the head, with two smaller peaks on either side, known as the shoulders. The trough between the left shoulder and the head acts as the neckline. In contrast to Double Top, the Head and Shoulders pattern is also considered a bearish reversal pattern. When the price breaks below the neckline, it suggests a potential trend reversal to the downside. Triple Top and Triple Bottom patterns are variations of Double Top and Double Bottom, respectively. Instead of two peaks or troughs, they have three consecutive ones. They also have corresponding necklines. Triple Top is considered a bearish reversal pattern, indicating a potential trend reversal to the downside, while Triple Bottom is a bullish reversal pattern, indicating a potential trend reversal to the upside. Ascending Triangle is a bullish continuation pattern characterized by a horizontal resistance line and a rising trendline. It is formed by connecting the swing highs with a horizontal line and the swing lows with an ascending trendline. When the price breaks above the resistance line, it suggests a continuation of the upward trend. Descending Triangle is a bearish continuation pattern characterized by a horizontal support line and a descending trendline. It is formed by connecting the swing lows with a horizontal line and the swing highs with a descending trendline. When the price breaks below the support line, it suggests a continuation of the downward trend. Unlike Double Top, these patterns are continuation patterns rather than reversal patterns. Advanced strategies can enhance the effectiveness of the double top pattern. Traders often combine it with other technical analysis tools such as trendlines, moving averages, and oscillators like the Relative Strength Index (RSI) to confirm the pattern and improve trade accuracy. The double top pattern is versatile and can be used in various trading styles, such as swing trading and day trading. Swing traders often use it to identify potential reversals in the medium to long-term trend, while day traders use it for short-term trading opportunities. Every double top pattern may not look exactly alike. Depending on market conditions, variations can occur, like one peak being higher than the other or the neckline being inclined. Traders must adapt to these variations and interpret them correctly for successful trading. Despite its popularity, the double top pattern has critics. Some argue that chart patterns like the double top are self-fulfilling prophecies, only working because many traders believe in them. Others say that they're too subjective and can lead to differing interpretations. Common mistakes include misidentifying the pattern, entering a trade too early before confirmation, or setting the stop-loss and profit targets incorrectly. Proper understanding and practice can help mitigate these issues. The double top pattern is a widely recognized bearish reversal chart pattern that holds significance in technical analysis across various financial markets. Its formation, characterized by two peaks and a neckline, indicates a potential shift in trend from bullish to bearish. The pattern's reliability and robustness make it a valuable tool for traders to anticipate market downturns and make informed trading decisions. However, traders should be aware of the risks and limitations associated with the pattern, such as false signals and potential retests of the neckline. By combining the double top pattern with other technical analysis tools and adapting to variations in market conditions, traders can enhance its effectiveness and improve trade accuracy. While the double top pattern has garnered popularity and widespread use, it is not without its critics. Some argue that chart patterns, including the double top, are self-fulfilling prophecies driven by traders' beliefs rather than objective market dynamics. Additionally, the subjective nature of interpreting chart patterns can lead to differing opinions and potential mistakes. It is crucial for traders to avoid common pitfalls such as misidentifying the pattern, entering trades prematurely, or setting stop-loss and profit targets incorrectly. Developing a solid understanding of the pattern and practicing its application can help traders mitigate these issues and improve their trading performance.What Is Double Top?
Formation of the Double Top
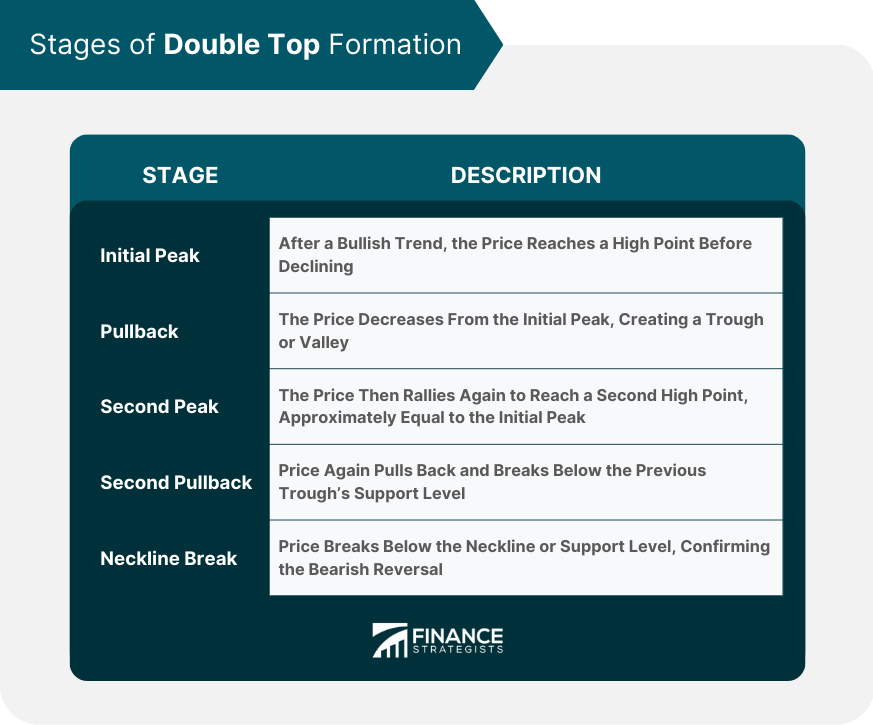
Stages of Double Top Formation
1. Initial Peak: After a bullish trend, the price reaches a high point before declining.
2. Pullback: The price decreases from the initial peak, creating a trough or valley.
3. Second Peak: The price then rallies again to reach a second high point, approximately equal to the initial peak.
4. Second Pullback: Price again pulls back, but this time, it breaks below the previous trough's support level.
5. Neckline Break: The price breaks below the neckline or support level, confirming the bearish reversal.
Key Factors in Recognizing a Valid Double Top
Typical Timeframe for Double Top Formation
Double Top and Market Psychology
Psychology Behind Double Top
Relation to Investor Sentiment and Behavior
Trading the Double Top
Detailed Strategy for Trading the Double Top Pattern
1. Identifying Entry Point: The ideal entry point is after the price breaks the neckline, confirming the pattern.
2. Setting Stop Losses: A stop-loss order should be placed slightly above the highest point of the two peaks to limit potential losses.
3. Determining Profit Targets: The price target after the neckline break is typically the distance from the peaks to the neckline, subtracted from the neckline.
Risks and Limitations of Trading the Double Top Pattern
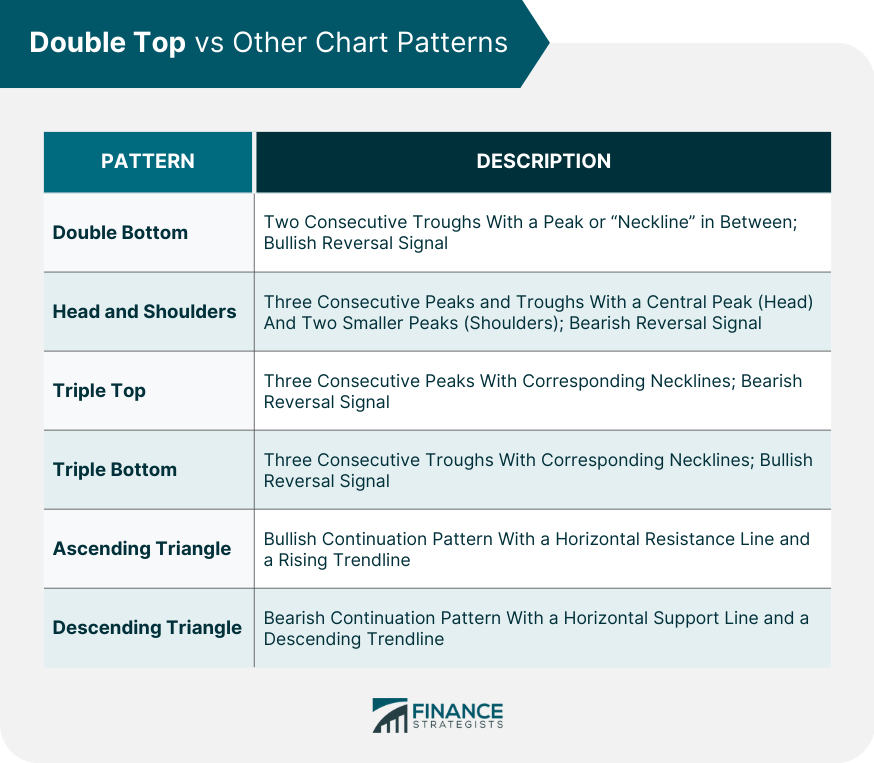
Double Top vs Other Chart Patterns
Double Bottom
Head and Shoulders
Triple Top and Triple Bottom
Ascending and Descending Triangles
Advanced Double Top Strategies
Combining With Other Technical Analysis Tools
Using Double Top in Different Types of Trading
Adapting to Market Conditions and Variations in the Double Top Pattern
Critiques and Limitations of the Double Top Pattern
Technical Analysis and Double Top Pattern
Common Mistakes
Final Thoughts
Double Top FAQs
The neckline in a double top pattern plays a crucial role. It represents a support level that connects the lows between the two peaks. A break below the neckline confirms the pattern and signals a bearish reversal, indicating a potential trend shift from bullish to bearish.
Yes, the double top pattern can be observed in various financial markets, including stocks, commodities, foreign exchange (forex), indices, and cryptocurrencies. Its reliability and importance remain consistent across these different markets.
The ideal entry point for trading a double top pattern is after the price breaks below the neckline, confirming the pattern's bearish reversal. This breakout acts as a signal to enter a short position and take advantage of the anticipated downward price movement.
To manage risks, traders can set stop-loss orders slightly above the highest point of the two peaks. This helps limit potential losses if the price unexpectedly reverses. It's essential to carefully determine the level of risk one is willing to take and adjust the stop-loss accordingly.
Yes, there are variations and similar patterns to the double top. One example is the triple top pattern, which consists of three consecutive peaks and a corresponding neckline. Additionally, the head and shoulders pattern is another reversal pattern with three peaks and troughs, indicating a bearish reversal. These patterns provide traders with alternative signals for potential trend reversals.
True Tamplin is a published author, public speaker, CEO of UpDigital, and founder of Finance Strategists.
True is a Certified Educator in Personal Finance (CEPF®), author of The Handy Financial Ratios Guide, a member of the Society for Advancing Business Editing and Writing, contributes to his financial education site, Finance Strategists, and has spoken to various financial communities such as the CFA Institute, as well as university students like his Alma mater, Biola University, where he received a bachelor of science in business and data analytics.
To learn more about True, visit his personal website or view his author profiles on Amazon, Nasdaq and Forbes.


