
In financial analysis, the Death Cross refers to a specific pattern on a stock chart. This pattern arises when a short-term moving average of a security's price crosses below its long-term moving average. Conventionally, the most common combination includes the 50-day moving average (short-term) crossing below the 200-day moving average (long-term). Death Cross signals a potential bearish (downward) market shift, giving investors a hint that it might be time to consider defensive measures. Historically, technical analysts have used the Death Cross as one of many tools to predict future price movements. It made its first appearance during the early years of technical analysis, dating back to the early 20th century. Understanding the Death Cross requires a solid grasp of moving averages—a key concept in the field of technical analysis. The two types of moving averages central to this concept are the Simple Moving Average (SMA) and the Exponential Moving Average (EMA). The SMA is the average price of a security over a specific number of periods. It is 'simple' because it assigns equal weight to all periods. For example, in a 50-day SMA, each of the 50 days contributes equally to the final average. On the other hand, the EMA assigns more weight to recent periods, making it more responsive to recent price changes. This feature makes the EMA a preferred choice for short-term traders interested in identifying quick shifts in market sentiment. The 50-day moving average is a key component of the Death Cross. It is the shorter-term moving average that is used to gauge the recent trend of a security. When this line trends upwards, it suggests bullish sentiment in the market. Conversely, when it trends downwards, it indicates bearish sentiment. Similarly crucial to the Death Cross, the 200-day moving average is a longer-term trend line. It smooths out the overall price data over a much extended period, reducing the effect of short-term price fluctuations and offering a clearer view of the overall market trend. A rising 200-day moving average suggests a long-term bullish trend, while a falling 200-day moving average points to a long-term bearish trend. A Death Cross is formed when the 50-day moving average crosses below the 200-day moving average. This event signifies a potential shift in trend from bullish to bearish. However, it's important to note that the Death Cross is a lagging indicator—it confirms a trend change that has already occurred, rather than predicting a new one. The bearish signal of the Death Cross serves as a warning to investors. It suggests that the short-term momentum of the security is declining faster than its long-term momentum, indicating growing bearish sentiment. Investors may then choose to re-evaluate their positions or introduce defensive strategies to protect their portfolios. The strength of the Death Cross signal can be influenced by several factors. For instance, the depth of the cross (the extent to which the 50-day moving average falls below the 200-day moving average) can signal the strength of the bearish trend. Similarly, the presence of other technical indicators, like volume spikes or other bearish patterns, can either reinforce or contradict the Death Cross signal. The Death Cross, while a significant technical indicator, does not operate in a vacuum. It must be interpreted in the context of prevailing market conditions. For example, a Death Cross appearing during a market-wide downturn may be a stronger bearish signal compared to one appearing during a bullish market. Misinterpretations of the Death Cross can lead to costly mistakes. For instance, reacting to a Death Cross without considering the overall market context can lead to premature selling. Similarly, considering the lagging nature of this indicator, traders must remember that a Death Cross confirms a bearish trend that has already happened, rather than predicting future market movements. While the Death Cross can provide valuable insights, it should not be the sole determinant of investment decisions. Other technical indicators, such as Relative Strength Index (RSI), Moving Average Convergence Divergence (MACD), and volume indicators, should also be considered for a comprehensive analysis. While the Death Cross is a lagging indicator, it is still revered for its ability to confirm long-term bearish trends. Historically, instances of Death Crosses have often preceded significant market downturns. However, this is not a fail-safe rule, and the occurrence of a Death Cross should be assessed with other market information. In trend analysis, the Death Cross can be used in conjunction with other trend indicators like the MACD, On Balance Volume (OBV), and Bollinger Bands, to name a few. These indicators can provide additional confirmation of a trend change or provide early warning signals of a potential Death Cross. The appearance of a Death Cross might prompt investors to sell their holdings to avoid potential losses from a bearish market. However, the timing of these decisions is crucial, considering the lagging nature of this indicator. Investors might also consider adjusting their asset allocation in response to a Death Cross, potentially reducing exposure to riskier assets and increasing allocation to safer assets, such as bonds or cash. From a risk management perspective, the Death Cross can serve as a valuable tool for detecting potential market downturns and enabling investors to implement protective measures accordingly. The Death Cross is most commonly used in the stock market, where it can signal long-term bearish trends. Investors and traders alike use this indicator as part of their technical analysis toolkit. In forex markets, the Death Cross can also provide valuable insights. However, due to the 24-hour nature of these markets, the sensitivity of the Death Cross may be heightened, leading to a higher chance of false signals. In commodity markets, the Death Cross can help traders identify potential downturns in commodity prices, providing key insights for both hedging and speculative activities. One of the main criticisms of the Death Cross is its susceptibility to false signals. This often occurs due to market noise—short-term fluctuations that can cause the 50-day moving average to dip below the 200-day moving average temporarily before bouncing back. The Death Cross, like any other technical indicator, relies on past price data. Critics argue that in efficient markets, all past information is already incorporated into current prices. Therefore, movements of moving averages and the occurrence of a Death Cross could be mere coincidences rather than indicators of future price action. Moreover, the Death Cross doesn't consider external economic factors that may influence the security's price. Changes in interest rates, economic policy changes, geopolitical events—these factors can all significantly impact market trends but are not reflected in the Death Cross indicator. The Golden Cross is the antithesis of the Death Cross. It occurs when the 50-day moving average crosses above the 200-day moving average, signaling a potential shift from a bearish to a bullish market trend. While the Death Cross signals an impending bear market, the Golden Cross suggests a bull market may be on the horizon. Both of these indicators signal significant market trend shifts and can prompt investors to adjust their strategies accordingly. The occurrence of a Death Cross might push investors to sell or adopt defensive strategies, while the appearance of a Golden Cross could encourage buying or more aggressive strategies. However, these decisions should always be made in the context of broader market conditions and personal investment goals. The Death Cross is a technical indicator that signals a potential bearish market shift. It occurs when a short-term moving average, typically the 50-day moving average, crosses below a long-term moving average, usually the 200-day moving average. While the Death Cross is a lagging indicator, confirming a trend change that has already occurred, it still holds significance in predicting long-term bearish trends. Despite its limitations and susceptibility to false signals, the Death Cross remains a valuable tool for investors in identifying potential market downturns and implementing risk management strategies. Furthermore, the Death Cross can be applied across different financial markets, including stocks, forex, and commodities. In stock markets, it is commonly used by investors and traders to assess long-term bearish trends. In forex markets, the Death Cross can provide insights, although the 24-hour nature of these markets may increase the likelihood of false signals. In commodity markets, the Death Cross assists traders in identifying potential downturns in commodity prices, supporting both hedging and speculative activities. However, it is important to remember that the Death Cross should not be the sole determinant of investment decisions but rather be used alongside other trend indicators and market information. Investing and trading are complex activities that require a good understanding of financial markets. While indicators like the Death Cross can provide valuable insights, they are not foolproof. Therefore, especially for novice investors, seeking professional advice may be beneficial to navigate the intricate world of financial markets effectively.What Is the Death Cross?
It is a relatively simple yet effective signal that has retained its relevance even in today's complex, technology-driven financial landscape.Components of the Death Cross
Moving Averages
Simple Moving Average
Exponential Moving Average
The 50-Day Moving Average
The 200-Day Moving Average
Death Cross Mechanics
The Creation Process
Role of the Bearish Signal
Factors Influencing the Signal
Interpretation of the Death Cross
Signal Strength and Market Conditions
Misinterpretations and Potential Mistakes
Importance of Other Technical Indicators
Death Cross in Market Trends Analysis
Predictive Capacity for Long-Term Downturns
Use Alongside Other Market Trend Indicators
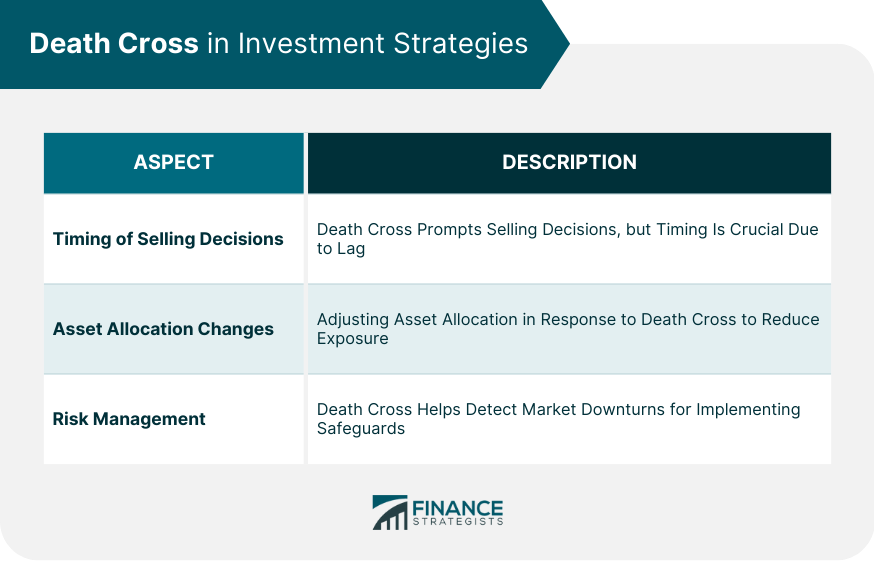
Death Cross in Investment Strategies
Timing of Selling Decisions
Asset Allocation Changes
Risk Management
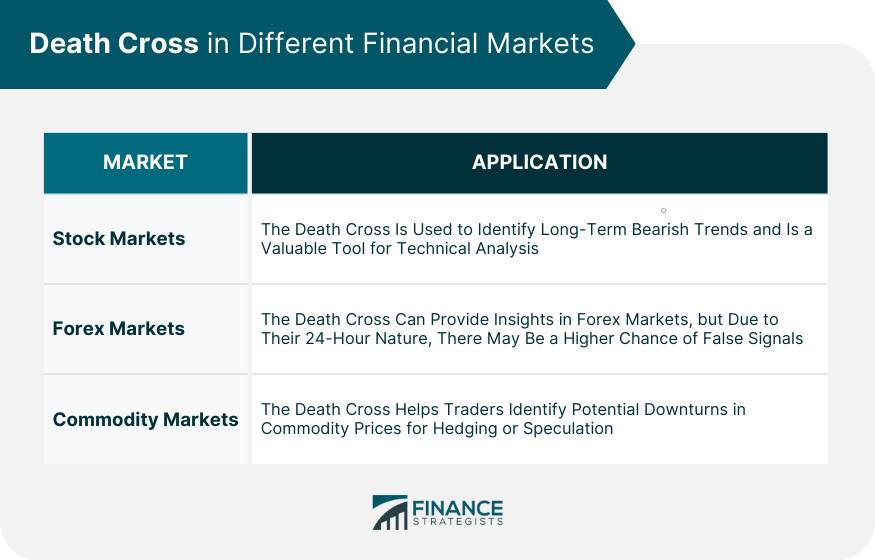
Death Cross in Different Financial Markets
Stock Markets
Forex Markets
Commodity Markets
Critiques and Limitations of the Death Cross
False Signals and Market Noise
Market Efficiency and Price Integration
Other Economic Factors
Death Cross vs Golden Cross
Definition and Comparison
Conditions
Market Implications
Final Thoughts
Death Cross FAQs
The Death Cross is considered a significant technical indicator; however, its reliability can vary. While it has historically preceded major market downturns, it is not infallible and can generate false signals due to market noise. It is crucial to consider other indicators and market conditions when interpreting the Death Cross.
The Death Cross is primarily used to identify long-term bearish trends rather than short-term market shifts. It confirms a trend change that has already occurred, making it less effective in predicting immediate price movements. Traders often rely on other indicators for short-term analysis.
Selling decisions based solely on the occurrence of a Death Cross can be risky. It is essential to consider the broader market context and personal investment goals. While the Death Cross may indicate a potential bearish market, investors should evaluate their portfolios and risk tolerance before making any selling decisions.
The Death Cross can be used across different financial markets, including stocks, forex, and commodities. It is commonly employed in stock market analysis to identify long-term bearish trends. However, its sensitivity may vary in forex markets due to their 24-hour nature. In commodity markets, the Death Cross assists in assessing potential downturns in commodity prices.
No, the Death Cross should not be the sole determinant of investment decisions. It is important to incorporate other technical indicators such as the Relative Strength Index (RSI), Moving Average Convergence Divergence (MACD), and volume indicators for a comprehensive analysis. These additional indicators provide further confirmation and insights into market trends.
True Tamplin is a published author, public speaker, CEO of UpDigital, and founder of Finance Strategists.
True is a Certified Educator in Personal Finance (CEPF®), author of The Handy Financial Ratios Guide, a member of the Society for Advancing Business Editing and Writing, contributes to his financial education site, Finance Strategists, and has spoken to various financial communities such as the CFA Institute, as well as university students like his Alma mater, Biola University, where he received a bachelor of science in business and data analytics.
To learn more about True, visit his personal website or view his author profiles on Amazon, Nasdaq and Forbes.


