
A wedge is a technical analysis pattern used in financial markets, illustrating an asset's narrowing price movement over time. It is identified by connecting a series of highs and lows on a price chart, forming converging trend lines, often resembling a 'wedge'. This pattern indicates a gradual shift in market sentiment and can signal a potential trend reversal. The ability to predict a trend change in a volatile market can offer valuable trading opportunities. The strength of wedge patterns lies in their capacity to capture the tension between buyers and sellers and predict who might eventually dominate. Trend lines, drawn by connecting multiple price points on charts, are another tool used by traders to identify and confirm market trends. They serve as dynamic support or resistance, aiding traders in making informed decisions, such as going long in an uptrend or short in a downtrend. Rising wedges are formed when the price of an asset is making higher highs and higher lows but at a slowing pace, causing the two trend lines to converge. The upper trend line is drawn by connecting the highs, and the lower trend line is drawn by connecting the lows. Over time, the distance between the trend lines narrows, giving it a wedge-like appearance. While the rising wedge may seem bullish due to the rising price, it is traditionally considered a bearish pattern. The reasoning is that the slowing momentum in the higher highs and lows may indicate weakening demand, suggesting that sellers could soon take control. Therefore, traders often look for a price break below the lower trend line as a potential sell signal. Falling wedges occur when the price is making lower highs and lower lows, but the pace is slowing, causing the trend lines to converge. The upper trend line is drawn by connecting the lower highs, and the lower trend line is drawn by connecting, the lower lows. The falling wedge is typically recognized as a bullish reversal pattern. The slowing pace of the lower highs and lows in a falling wedge may signal that selling pressure is waning and buyers might be preparing to take control. Traders often watch for a price break above the upper trend line as a potential buy signal. Wedge patterns can take shape over various time frames, typically between 10 and 50 trading periods, but they can sometimes last longer. Short-term wedges may occur over a few days on a daily chart, while long-term wedges may take several months to form on a weekly or monthly chart. Identifying the highs and lows is a crucial step in plotting a wedge. For a rising wedge, we connect the successive higher highs and higher lows, while for a falling wedge, we connect the successive lower highs and lower lows. The accuracy of these points can significantly influence the effectiveness of the wedge pattern. A distinctive aspect of wedge patterns is that the highs and lows increase or decrease at different rates. In a rising wedge, the lower line, representing the lows, is steeper than the upper line. Conversely, in a falling wedge, the upper line, representing the highs, is steeper than the lower line. These differing rates cause the trend lines to converge, forming a wedge. The converging trend lines form the essence of a wedge pattern. As the trend lines draw closer, it suggests a tightening price range and diminishing volume, building up potential for a breakout. The point of convergence, often called the "apex," does not necessarily have to be reached for a breakout to occur. In fact, breakouts often occur before reaching the apex. The primary purpose of a wedge pattern is to predict a potential price reversal. The convergence of the trend lines implies a growing tension between buyers and sellers, leading to a decisive breakout. For a rising wedge, a downward breakout is anticipated, indicating a bearish reversal. Conversely, for a falling wedge, an upward breakout signals a bullish reversal. In wedge analysis, volume plays a pivotal role in validating the pattern and the ensuing breakout. As the wedge forms, the trading volume typically contracts, reflecting the market's uncertainty. However, at the point of breakout, an increase in volume provides hstrong confirmation of the new trend. An absence of expanding volume may question the reliability of the breakout. A breakout signifies the end of the wedge pattern and the potential start of a new trend. It occurs when the price moves beyond one of the trend lines, typically on increased volume. The direction of the breakout (upwards for falling wedges and downwards for rising wedges) provides a cue for traders on whether to go long or short. The entry point following a wedge pattern largely depends on the breakout direction. For a rising wedge, a trader may look to short-sell after a downward breakout. Conversely, in a falling wedge, a trader may consider buying after an upward breakout. The breakout should ideally be accompanied by an increase in volume for stronger confirmation. A stop-loss order can be strategically placed to manage risk in trade following a wedge pattern. For a rising wedge, the stop loss can be placed just above the upper trend line (in case the price reverses and moves higher), while for a falling wedge, the stop loss can be set just below the lower trend line (in case the price turns and moves lower). The height of the wedge pattern (the vertical distance from the first high/low to the point of a breakout) can be used to estimate a target for taking profits. By projecting this height from the point of breakout, a trader can set a realistic profit target. Wedge patterns can be subjective, and their identification may differ between traders. Differences in selecting highs and lows can lead to varying interpretations, resulting in differing trading decisions. While wedges can provide potent signals, their reliability is often influenced by other market factors such as economic news, company earnings, or changes in market sentiment. Therefore, traders should use wedges in conjunction with other technical analysis tools or fundamental analysis. Wedge patterns can occasionally lead to false breakouts or whipsaws, where the price moves beyond a trend line but quickly reverse, leading to potential losses. It underscores the importance of setting stop losses and waiting for volume confirmation. Identifying key support and resistance levels alongside wedge patterns can provide added confirmation for trades. For instance, a breakout from a wedge that also breaches a significant support or resistance level can be seen as a stronger signal. Moving averages can help identify the underlying trend and provide additional buy or sell signals. For example, a breakout from a falling wedge that is accompanied by the price crossing above a significant moving average could reinforce the bullish signal. The Relative Strength Index (RSI) can be used to identify overbought or oversold conditions. If the breakout from a wedge aligns with the RSI moving out of the overbought or oversold territory, it can provide further conviction to the trade. Fibonacci retracement levels can offer potential target levels after a breakout from a wedge pattern. Traders can use these levels to determine where the price might encounter support or resistance following the breakout. Wedges are a crucial pattern in technical analysis, signifying potential price reversals in financial markets. The two primary types, rising and falling wedges, denote bearish and bullish reversals, respectively. The formation of a wedge pattern relies on identifying successive highs and lows and recognizing the convergence of trend lines. Interpreting wedge patterns involves predicting price reversals, understanding the role of volume, and acknowledging the significance of breakouts. However, it's important to note that wedge patterns have limitations, including misinterpretations, dependency on other market factors, and the risk of false breakouts or whipsaws. Given these complexities, it might be beneficial to seek professional wealth management services to effectively navigate the financial markets using technical analysis tools like wedges.What Is a Wedge?
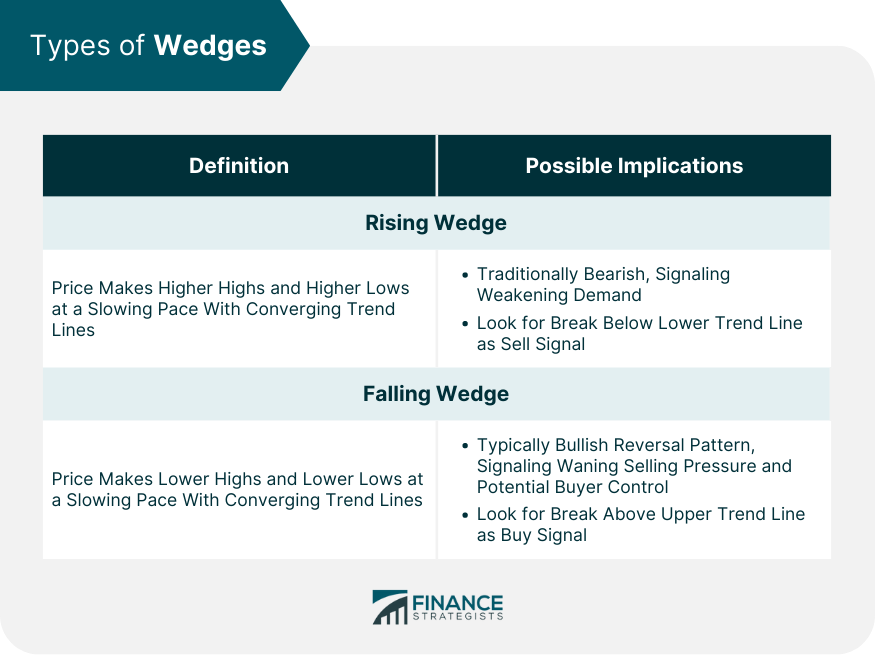
Types of Wedges
Rising Wedges
Falling Wedges
Formation of Wedge Patterns
Periods of Formation
Identification of Highs and Lows
Differing Rates of Highs and Lows
Convergence of Trend Lines
Interpretation of Wedge Patterns
Predicting Price Reversals
Role of Volume in Confirming Wedge Patterns
Significance of Breakouts
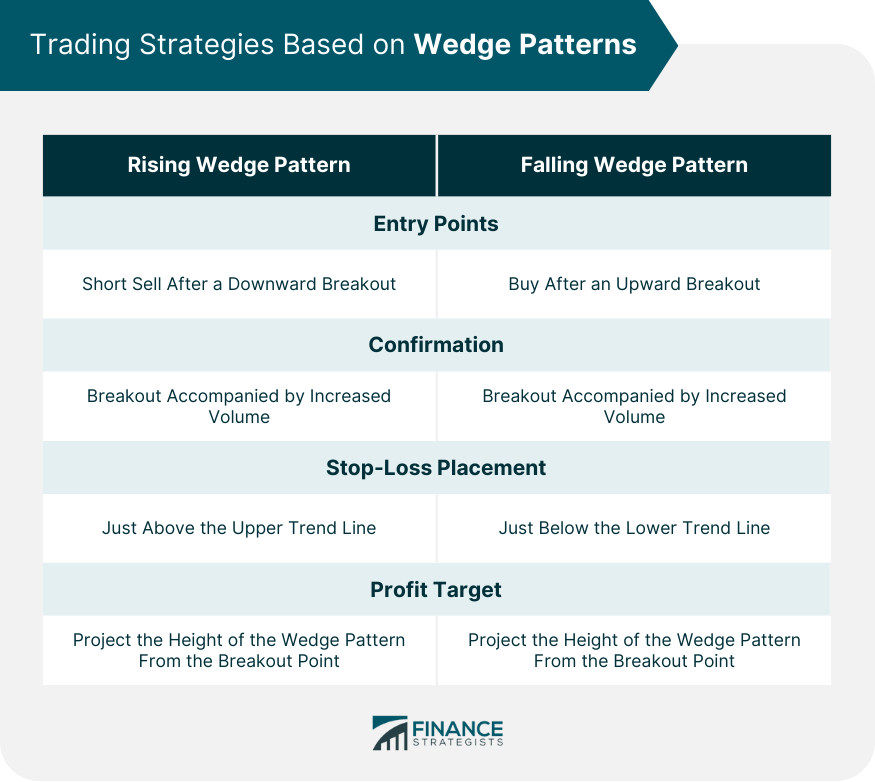
Trading Strategies Based on Wedge Patterns
Entry Points for Trading
Setting Stop-Loss Orders
Targets for Taking Profits
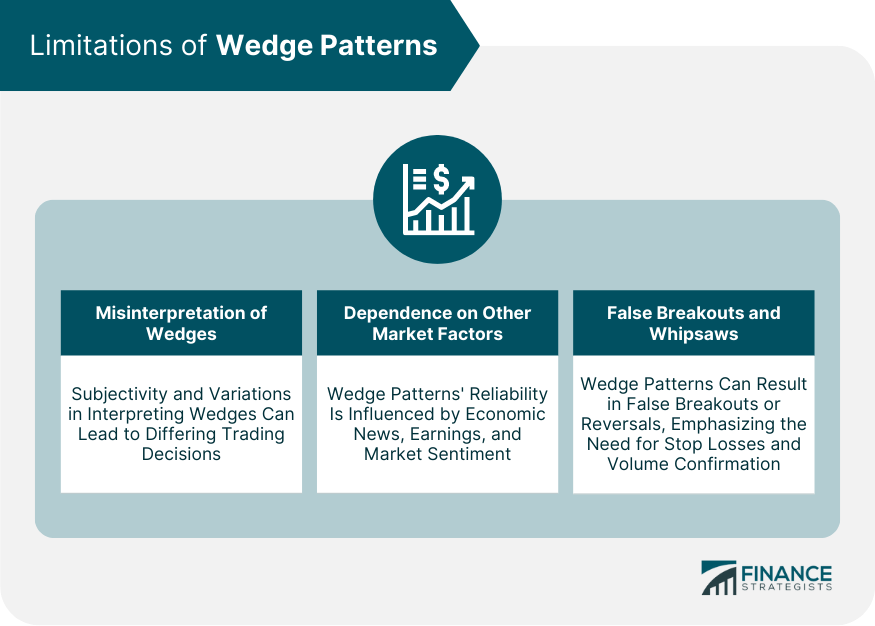
Limitations of Wedge Patterns
Misinterpretation of Wedges
Dependence on Other Market Factors
False Breakouts and Whipsaws
Other Technical Analysis Tools in Conjunction With Wedges
Support and Resistance Levels
Moving Averages
Relative Strength Index (RSI)
Fibonacci Retracement
Final Thoughts
Wedge FAQs
Wedges are chart patterns used in technical analysis to predict potential price reversals. They are characterized by converging trend lines connecting successive highs and lows.
Rising wedges are typically bearish patterns where the price makes higher highs and higher lows but at a slowing pace. Falling wedges are often bullish patterns, with the price making lower highs and lower lows, but the rate of descent is slowing.
Wedge patterns are formed by drawing trend lines connecting successive highs and lows. The trend lines converge, forming a pattern that resembles a wedge.
Volume usually contracts as a wedge forms, signifying market uncertainty. An increase in volume at the breakout point is a strong confirmation of a new trend.
Limitations of wedges include potential misinterpretation, dependence on other market factors, and the risk of false breakouts or whipsaws. Thus, they should be used in conjunction with other technical analysis tools.
True Tamplin is a published author, public speaker, CEO of UpDigital, and founder of Finance Strategists.
True is a Certified Educator in Personal Finance (CEPF®), author of The Handy Financial Ratios Guide, a member of the Society for Advancing Business Editing and Writing, contributes to his financial education site, Finance Strategists, and has spoken to various financial communities such as the CFA Institute, as well as university students like his Alma mater, Biola University, where he received a bachelor of science in business and data analytics.
To learn more about True, visit his personal website or view his author profiles on Amazon, Nasdaq and Forbes.


