
The term "Shooting Star" refers to a specific type of candlestick pattern. This pattern is a visual representation of a specific set of trading behaviors and is used to predict potential future price movements. The Shooting Star is particularly well known for its predictive power in indicating potential bearish reversals – situations where the price of an asset, previously in an uptrend, may begin to fall. This pattern, aptly named for its star-like appearance, is characterized by a small body at the lower end of the trading range and a long upper wick or shadow that is typically at least twice the length of the body. The body represents the range between the opening and closing prices for the period, while the shadow reflects the range between the highest and lowest prices. The Shooting Star pattern holds a special place in the toolkit of many traders and technical analysts because of its predictive power. This pattern can signal an impending reversal of a bullish trend, acting as a warning sign for traders to potentially exit long positions or to consider entering short positions. Shooting Stars indicate a strong selling pressure. Despite prices pushing higher during the trading session, sellers step in and push prices back down to close near where they opened. This failure of the price to sustain higher levels signals a potential shift in momentum from buyers to sellers. Before a Shooting Star pattern can be identified, there must first be an established uptrend in the market. This uptrend represents a period of sustained buying pressure, pushing the price of an asset higher over time. It sets the stage for the pattern, providing a contrast for the sudden potential change in sentiment that the Shooting Star represents. As the market sentiment becomes overextended, it creates an opportunity for a reversal to occur. The Shooting Star can then be seen as the initial warning sign of this impending shift, signaling the possibility of the end of the uptrend and the beginning of a potential downtrend. The formation of a Shooting Star pattern begins with the opening price for the period, which is typically near the high of the session. This indicates a continuation of the existing bullish sentiment from the previous trading periods, as buyers continue to exert pressure on the market, pushing prices higher. However, as the trading session progresses, the initial buying pressure begins to wane. The high opening price stands in stark contrast to the following price actions during the session, setting the stage for the emergence of the Shooting Star. After the market opens near its high, the price begins to decline during the session. This price decline is a crucial part of the Shooting Star formation. It signals the shift in market sentiment from bullish to potentially bearish. This decline occurs as sellers start to overwhelm the buyers in the market. The increased selling pressure drives the price down, away from the high of the session. This process creates the long upper shadow that is characteristic of the Shooting Star pattern. As the session progresses, the selling pressure continues to push the price lower, eventually leading to a close near the session's low. This lower close forms the small body of the Shooting Star pattern and signifies a significant shift in the balance of power from buyers to sellers. The closing price near the low of the session is a crucial component of the Shooting Star pattern. It reflects a failure of buyers to maintain control over the market, increasing the likelihood of a potential trend reversal. Taken together, these factors – a high open, a decline during the session, and a low close – form the Shooting Star pattern and indicate a potential bearish reversal. This pattern signals that, despite the initial bullish sentiment, sellers have taken control of the market by the end of the trading period. The Shooting Star, therefore, serves as a warning sign to traders that the current uptrend may be coming to an end, potentially giving way to a new downtrend. One of the key characteristics that distinguish the Shooting Star pattern is the length of the upper shadow. This shadow should be at least twice the size of the real body, signaling a significant price retreat from the highs of the session. The extended upper shadow represents a failed attempt by buyers to keep prices elevated. A longer upper shadow indicates a stronger rejection of the higher prices, suggesting a more substantial potential reversal. Another feature to look for when identifying Shooting Star patterns is a small or nonexistent lower shadow. The absence of a significant lower shadow indicates that the closing price was near the low of the trading period, signaling strong selling pressure. A lack of a lower shadow underscores the potency of the selling pressure during the session. It serves as a visual reminder that sellers were able to maintain control from the high of the session down to the close. The color and size of the real body of the Shooting Star can provide additional clues about the potential reversal. A bearish Shooting Star, where the closing price is lower than the opening price, is considered more significant than a bullish one, as it indicates stronger selling pressure. The size of the body, meanwhile, should be relatively small compared to the length of the upper shadow. This size differential emphasizes the impact of the selling pressure during the session. Volume can serve as a critical confirmation factor when identifying Shooting Star patterns. An increase in trading volume during the session that forms the Shooting Star can provide additional validation of the pattern. A surge in volume shows an increased level of activity and interest in the asset. When combined with the formation of a Shooting Star, it can suggest a more substantial shift in sentiment, reinforcing the potential bearish reversal signal. Finally, the placement of the Shooting Star within the overall trend is an essential aspect of pattern recognition. A Shooting Star that occurs after a sustained uptrend is seen as a potentially more significant reversal signal than one that appears during a sideways or downward trend. A Shooting Star appearing at the peak of an uptrend can indicate that the uptrend may have run its course. It serves as a warning sign that the bullish sentiment may be waning and a bearish reversal may be imminent. Shooting Star patterns emerge due to a change in the balance of buying and selling pressure in the market. Initially, in an uptrend, buyers dominate, pushing prices higher. However, when a Shooting Star forms, it signals a potential shift in this dynamic, with sellers starting to gain the upper hand. This change can be triggered by a variety of factors, including changes in market sentiment, news events, or a reassessment of the asset's value by market participants. The imbalance that results can lead to the distinctive price movements that create a Shooting Star. The sentiment and expectations of market participants play a critical role in the formation of Shooting Star patterns. If traders and investors start to believe that an asset is overpriced or that a bullish trend has run its course, they may begin selling, causing the price to drop. This change in sentiment can create the selling pressure needed for a Shooting Star to form. Consequently, gauging market sentiment – through indicators like market surveys or implied volatility – can be essential in predicting and understanding these patterns. Market liquidity and order flow can also influence the formation of Shooting Star patterns. In highly liquid markets, large volumes of trading orders can be executed without significantly impacting the price. However, when liquidity decreases, orders can start to affect the price more dramatically, leading to larger price swings. These price swings can contribute to the formation of Shooting Star patterns. Moreover, changes in order flow – the balance of buy and sell orders at different prices – can reflect shifts in market sentiment that lead to these patterns. High volatility often accompanies the formation of Shooting Star patterns. As buyers and sellers battle for control of the market, the price can swing widely, leading to the long upper shadow characteristic of these patterns. High volatility can indicate heightened uncertainty or disagreement about an asset's value among market participants. When combined with other factors like a shift in market sentiment or a decrease in liquidity, this volatility can facilitate the formation of Shooting Star patterns. Increased trading activity and participation can also contribute to the formation of Shooting Star patterns. When more participants enter the market, the balance of supply and demand can shift more rapidly, leading to more significant price movements. For example, if a large number of sellers enter the market, they can overwhelm the buyers, pushing the price down and potentially leading to a Shooting Star. Conversely, if buyers withdraw from the market, a similar effect can occur. News events and market catalysts can have a significant impact on volatility, contributing to the formation of Shooting Star patterns. These events can cause sudden shifts in market sentiment, leading to dramatic price movements. For example, an unexpected earnings announcement, a change in monetary policy, or a significant geopolitical event can cause traders and investors to reassess their views on an asset. This reassessment can result in increased selling pressure, potentially leading to a Shooting Star pattern. One common strategy for utilizing Shooting Star patterns involves identifying these patterns as potential entry points for short selling. Short selling is a trading strategy where a trader borrows an asset to sell it, with the expectation that the price will fall, allowing them to buy it back at a lower price for a profit. A Shooting Star can signal an upcoming bearish reversal, making it a potentially opportune time to enter a short position. Traders using this strategy aim to capitalize on the expected downturn in price following the emergence of a Shooting Star. While the Shooting Star can be a powerful signal, it's important to use it in conjunction with appropriate risk management strategies. These might include setting stop-loss orders to limit potential losses, diversifying trading positions to spread risk, or using derivatives like options to hedge against unfavorable price movements. Even though the Shooting Star is seen as a strong bearish signal, there's no guarantee that a reversal will occur. Therefore, managing risk effectively is crucial when using these patterns as part of a trading strategy. Setting profit targets and stop-loss levels is a key component of a successful trading strategy involving Shooting Star patterns. Profit targets allow traders to lock in gains when the price moves in a favorable direction, while stop-loss orders can help limit losses if the price moves against the position. Traders may set these levels based on key support or resistance levels, volatility, or the asset's historical price range. These targets and stop-loss levels provide a structured approach to trading, helping to remove emotion from decision-making and encouraging discipline. Specifically, determining appropriate stop-loss levels can be crucial in managing risk when trading based on Shooting Star patterns. These levels are typically set above the high of the Shooting Star, providing protection if the price rises instead of falling as expected. Stop-loss orders automatically close a position if the price reaches a predetermined level, limiting the potential loss on a trade. By setting these levels strategically, traders can manage their potential downside risk while capitalizing on the predictive power of Shooting Star patterns. Like any technical analysis tool, Shooting Star patterns come with potential risks and limitations. One of the main concerns is the possibility of false signals. Despite the pattern's reputation as a bearish reversal signal, the expected price drop doesn't always occur. This can happen for various reasons, such as strong underlying bullish sentiment, unexpected news events, or simply the random nature of price movements. Therefore, traders should use Shooting Star patterns in conjunction with other technical analysis tools and indicators to confirm signals and increase reliability. Conflicting market conditions can also pose challenges when using Shooting Star patterns. These patterns typically signal bearish reversals following an uptrend. However, if other market conditions or indicators suggest continued bullishness, it can create confusion. For example, strong positive economic data or bullish news events could conflict with the bearish signal from a Shooting Star. In these situations, traders must carefully evaluate all available information to make informed decisions. Another limitation is that Shooting Star patterns provide incomplete information. They can suggest potential bearish reversals but don't provide any information about the potential extent or duration of the reversal. To fill in these gaps, traders can use additional technical analysis tools, such as trend lines, moving averages, or momentum indicators. These tools can help provide a fuller picture of the market and support more informed decision-making. Finally, there's a risk of overemphasis on pattern recognition when using Shooting Star patterns. While these patterns can be powerful tools, they should not be used in isolation. Overreliance on pattern recognition can lead to overlooking other important factors like fundamentals, market sentiment, and broader economic conditions. To avoid this pitfall, traders should adopt a balanced approach, combining pattern recognition with a broader analysis of market conditions. This will help ensure that decisions are based on a comprehensive understanding of the market. Shooting Star patterns are powerful technical analysis tools, widely recognized for their potential to signal bearish reversals. They are characterized by a small body near the lower end of the trading range and a long upper shadow, reflecting a struggle between buyers and sellers in the market. Understanding and recognizing these patterns can provide valuable insights for traders, offering potential entry points for short selling or warning signs to exit long positions. However, like all technical analysis tools, they should be used in conjunction with other indicators and strategies to increase reliability and manage risk effectively. Importantly, while these patterns can provide predictive power, they are not foolproof. False signals can occur, and other market conditions can sometimes conflict with the signals provided by Shooting Star patterns. A balanced approach that combines pattern recognition with a broader analysis of market conditions and risk management is crucial for success.Definition of a Shooting Star
Importance of Shooting Stars
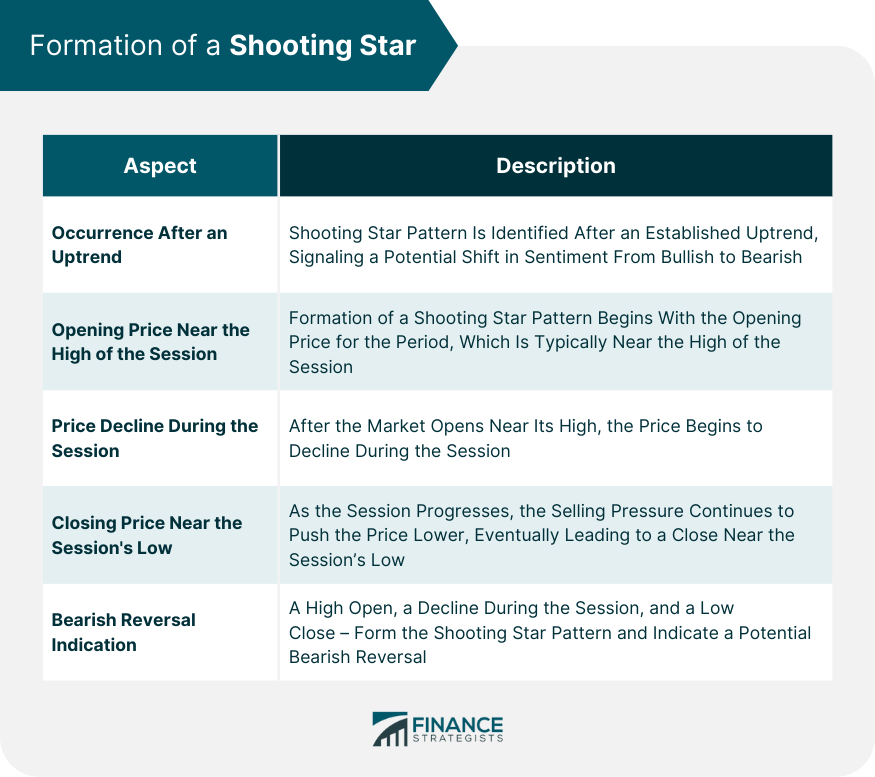
Formation of a Shooting Star
Occurrence After an Uptrend
Opening Price Near the High of the Session
Price Decline During the Session
Closing Price Near the Session's Low
Bearish Reversal Indication
Identifying Shooting Star Patterns
Upper Shadow Length
Small or Nonexistent Lower Shadow
Body Color and Size
Confirmation With Volume
Placement Within the Trend
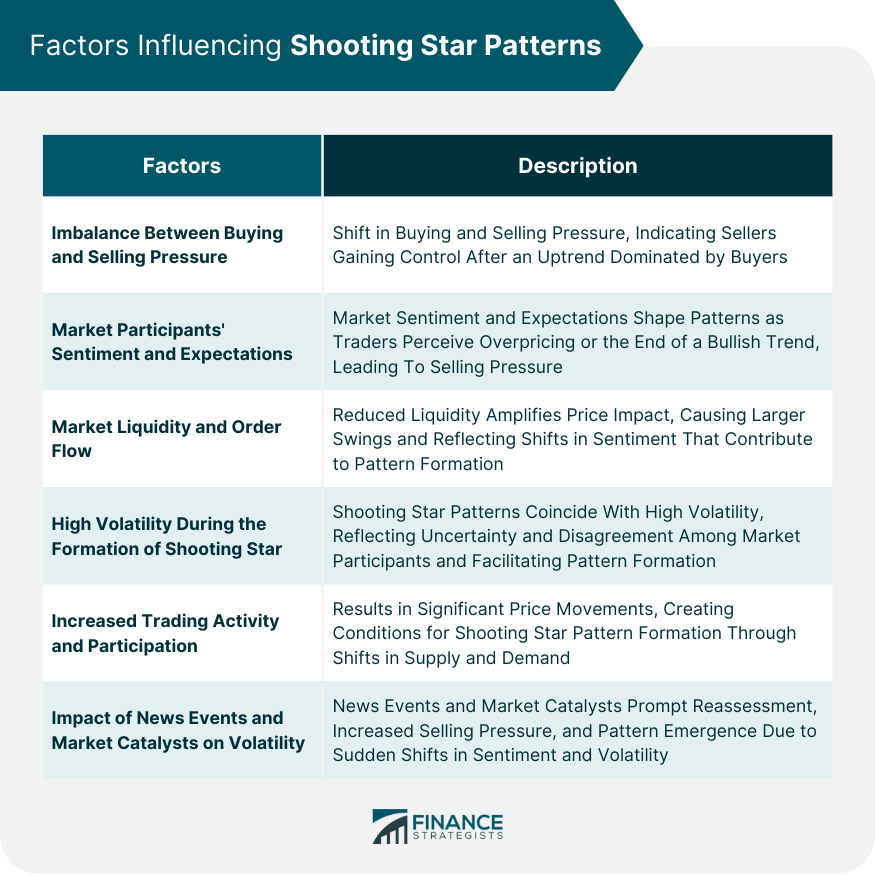
Factors Influencing Shooting Star Patterns
Imbalance Between Buying and Selling Pressure
Market Participants' Sentiment and Expectations
Market Liquidity and Order Flow
High Volatility During the Formation of Shooting Stars
Increased Trading Activity and Participation
Impact of News Events and Market Catalysts on Volatility
Strategies for Utilizing Shooting Star Patterns
Identifying Shooting Star Patterns as Potential Entry Points for Short-Selling
Implementing Appropriate Risk Management Strategies
Setting Profit Targets and Stop-Loss Levels
Determining Stop-Loss Levels to Manage Risk
Risk and Limitations of Shooting Star Patterns
False Signals and Reliability Concerns
Conflicting Market Conditions
Incomplete Information
Overemphasis on Pattern Recognition
Conclusion
Shooting Star FAQs
A Shooting Star is a bearish reversal candlestick pattern characterized by a small body at the lower end of the trading range and a long upper shadow. It signals a potential bearish reversal, suggesting that the price may start to fall after a period of rising.
A Shooting Star pattern is formed when the market opens near its high, prices decline during the trading session, and the market closes near its low, with a long upper shadow reflecting a failed attempt by buyers to keep prices elevated.
Traders often use Shooting Star patterns as potential entry points for short selling, anticipating a fall in price. However, it's essential to implement appropriate risk management strategies, such as setting stop-loss orders, to protect against potential losses.
While Shooting Star patterns can provide valuable signals, they also have limitations. They can give false signals, and other market conditions can sometimes conflict with their bearish signal. They also provide incomplete information, as they don't indicate the potential extent or duration of a price reversal.
Factors that can influence the formation of Shooting Star patterns include changes in buying and selling pressure, shifts in market sentiment, changes in market liquidity and order flow, volatility, trading activity, and the impact of news events or market catalysts.
True Tamplin is a published author, public speaker, CEO of UpDigital, and founder of Finance Strategists.
True is a Certified Educator in Personal Finance (CEPF®), author of The Handy Financial Ratios Guide, a member of the Society for Advancing Business Editing and Writing, contributes to his financial education site, Finance Strategists, and has spoken to various financial communities such as the CFA Institute, as well as university students like his Alma mater, Biola University, where he received a bachelor of science in business and data analytics.
To learn more about True, visit his personal website or view his author profiles on Amazon, Nasdaq and Forbes.


