
A pullback in the field of technical analysis refers to a brief reversal of the prevailing trend, be it upward or downward. It's a temporary phenomenon, where the price of a financial instrument—such as a stock, cryptocurrency, or commodity—decreases in an uptrend or increases in a downtrend, before resuming the original trend. It’s crucial to note that a pullback doesn't signify a trend change, merely a pause. Understanding pullbacks is instrumental in formulating effective trading strategies. They provide potential opportunities for traders to enter the market at a more favorable price. They can serve as a confirmation of the ongoing trend, thus solidifying the trader's conviction in their decision. Recognizing pullbacks can also help in risk management, as traders can better prepare for possible price fluctuations. Pullbacks can be understood as the market's 'breather.' They are slight contrarian movements that happen within a more substantial bullish or bearish trend. Pullbacks in an uptrend are characterized by a series of lower highs and lower lows, whereas in a downtrend, they exhibit higher highs and higher lows. These contrarian movements are often caused by short-term profit-taking or sector rotation. Certain market conditions tend to trigger pullbacks. When a financial instrument's price increases rapidly, the asset may become overbought, leading to a pullback as traders sell to realize profits. Conversely, if an asset's price decreases too fast, it may become oversold, resulting in a pullback as traders buy the dip. News and announcements can also cause temporary pullbacks, especially if they create uncertainty. Before using any technical tools, it's crucial to understand price action – the movement of an asset's price over time. The first step in identifying a pullback is to determine the prevailing trend, be it bullish (upward) or bearish (downward). In an uptrend, prices generally make higher highs and higher lows. Conversely, in a downtrend, prices make lower highs and lower lows. A pullback occurs when there's a temporary reversal of this pattern, with lower highs and lower lows seen in an uptrend, and higher highs and higher lows in a downtrend. However, it's important to remember that these counter-trend movements are usually short-lived and do not change the overall trend. Once the pullback is over, the price will resume its original trend. Once you've ascertained the prevailing trend and observed a counter-trend price movement, the next step is to use technical indicators to confirm whether this movement is a pullback. Consider the following: The RSI is a momentum oscillator that measures the speed and change of price movements on a scale of 0 to 100. If the RSI is above 70, it indicates that the asset may be overbought and a downward pullback could be imminent. Conversely, if the RSI is below 30, it suggests that the asset may be oversold and an upward pullback may be expected. Moving averages smooth out price data to identify the trend over a specific period. Traders often look for the price to pull back to a significant moving average, like the 50-day or 200-day, before resuming the original trend. It refers to the number of shares or contracts traded in a security or market during a given period. It is often the case that volume declines during a pullback, reinforcing the idea that the move is temporary. In an uptrend, a trendline drawn below the price action can act as a guide, with the price often bouncing off this line during a pullback. In a downtrend, the trendline is drawn above the price action and can similarly act as a guide during a pullback. These are price levels at which the asset's price tends to stop and reverse. In an uptrend, the price often pulls back to a support level before resuming its climb. In a downtrend, the price usually pulls back to a resistance level before continuing its descent. When the price approaches these lines during a counter-trend movement, and you see other confirming signals (like those from technical indicators), it may suggest that a pullback is occurring. Differentiating between pullbacks and reversals is essential in market analysis. While both involve counter-trend price movements, their implications are distinct. Pullbacks are temporary and are followed by a resumption of the initial trend. In contrast, reversals signify a more fundamental shift in the market's direction. In other words, after a pullback, the price resumes its original path, but after a reversal, the price moves in the opposite direction of the initial trend. To illustrate, suppose a stock in an uptrend experiences a 5% drop over a few days, only to resume its climb thereafter. This brief drop is a pullback. On the other hand, if the stock’s price dips by 20%, continues to decline, and establishes a new downward trend, that is a reversal. It involves entering the market after a pullback within a clear trend. Traders wait for the pullback to show signs of resumption of the original trend, such as breaking a short-term counter-trendline or forming a bullish or bearish candlestick pattern. The breakout pullback strategy is based on the price breaking out of a significant support or resistance level and then pulling back to the level it broke out from. Traders wait for a confirmation that the price will continue its trend before entering a trade. This strategy uses moving averages, a trend-following tool, to identify potential pullbacks. A trader might look for the price to pull back to a significant moving average, like the 50-day or 200-day, and then bounce off of it. Traders often set the stop-loss below the low of a pullback in an uptrend or above the high of a pullback in a downtrend. This approach limits the potential loss if the price continues moving against the trader's position. The profit target could be the previous high in an uptrend or the previous low in a downtrend. Having a predefined profit target helps ensure that traders take profits at appropriate times instead of letting profitable trades turn into losses. Pullbacks provide an opportunity to enter the market at a better price point. In an uptrend, for example, a pullback allows you to buy an asset at a lower price than the current market price. This "buying the dip" strategy can improve potential profits if the trend continues upward. Pullbacks can serve as a confirmation of the current trend. If the price resumes its initial trend after a pullback, it reaffirms the trend's strength. This can boost a trader's confidence in their market analysis and trading decisions. For short-term traders and swing traders, pullbacks can signal profitable exit points. If a trader anticipates a pullback after a significant price move, they can close their position and lock in profits before the pullback occurs. Pullbacks occur in all types of markets – uptrends, downtrends, and even range-bound markets. This means that regardless of the broader market conditions, pullbacks can provide trading opportunities. If traded correctly, pullbacks can lead to substantial profits. By entering at a better price during a pullback, traders can maximize the benefit from the trend's continuation. One of the most significant challenges in trading pullbacks is the risk of misidentifying a market reversal as a pullback. Both phenomena involve a counter-trend price movement, but their outcomes are different. While a pullback is a temporary pause in the trend, a market reversal indicates a change in the primary trend. Mistaking a reversal for a pullback could lead to substantial losses as the price moves against the trader's expectations. A trader may enter too early, while the price is still declining in an uptrend or increasing in a downtrend. Alternatively, a trader may enter too late, after the price has already resumed its trend. Both scenarios could lead to reduced profits or increased losses. Technical analysis is not infallible, and false signals are a common pitfall. Indicators might suggest a pullback, but the price could continue in its counter-trend direction. For example, an overbought or oversold signal on the RSI may fail to result in a pullback. Relying solely on these signals without considering the broader market context could result in premature or misguided trades. Pullbacks often occur during periods of high market volatility, which can make them challenging to trade. Increased volatility can lead to larger-than-expected counter-trend movements, potentially triggering stop-loss orders and resulting in losses. Pullbacks can test a trader's emotions. It can be unnerving to see a trade move against your position, even if it's a pullback and therefore a theoretically expected movement. Emotional reactions can lead to hasty decisions, like closing a position prematurely or moving a stop loss, which could harm trading performance. If a trader makes frequent trades based on pullbacks, it could result in increased transaction costs, such as commissions and spreads. These costs can eat into potential profits, particularly if the trader is working with a small account size. Defined as temporary reversals of a prevailing trend, pullbacks offer unique opportunities to enter the market at advantageous price points, manage risk, and potentially maximize profits. Equipped with the knowledge to distinguish a pullback from a full market reversal, traders can identify better entry and exit points, thus leading to more strategic trading decisions. However, as with all trading strategies, employing pullbacks is not without its challenges. From the risk of misidentifying market reversals as pullbacks to the psychological test of seeing a trade move against your position, trading pullbacks demands a certain level of acumen and emotional resilience. Moreover, factors like high market volatility and increased transaction costs can also pose significant obstacles. Despite these challenges, with a comprehensive understanding of the concept, effective use of technical indicators, and sound risk management practices, traders can skillfully navigate these hurdles and harness the potential of pullbacks in their trading strategies.What Is a Pullback?
How a Pullback Works
Identifying a Pullback
Price Action
Technical Indicators
Relative Strength Index (RSI)
Moving Averages
Volume
Use of Trendlines and Support/Resistance Levels
Trendlines
Support and Resistance Levels
Pullback vs Reversals
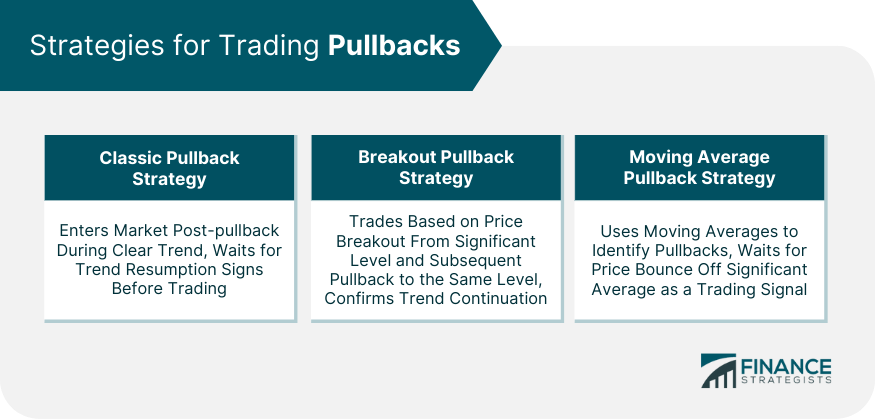
Strategies for Trading Pullbacks
Classic Pullback Strategy
Breakout Pullback Strategy
Moving Average Pullback Strategy
Managing Risk With Pullbacks
Setting Stop-Loss Points
Defining a Profit Target
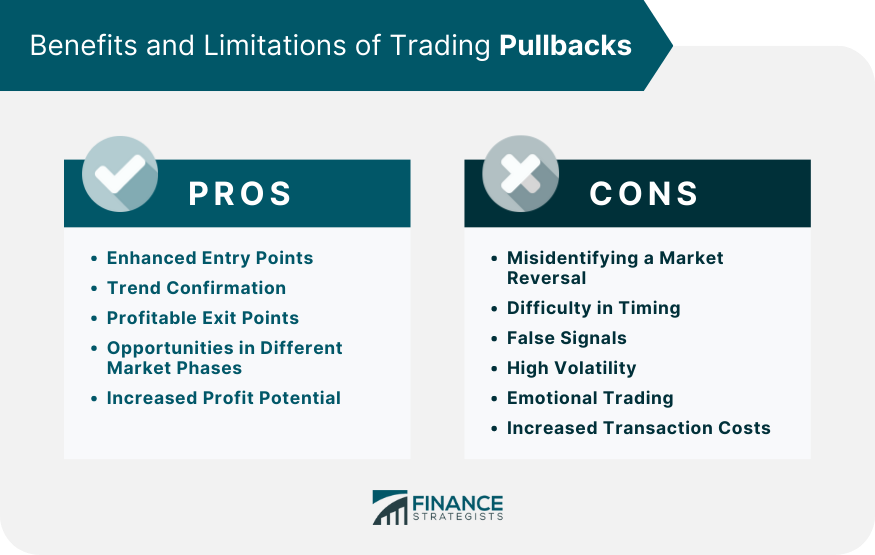
Benefits of Trading Pullbacks
Enhanced Entry Points
Trend Confirmation
Profitable Exit Points
Opportunities in Different Market Phases
Increased Profit Potential
Limitations and Challenges of Trading Pullbacks
Misidentifying a Market Reversal
Difficulty in Timing
False Signals
High Volatility
Emotional Trading
Increased Transaction Costs
Final Thoughts
Pullback FAQs
A pullback, in the context of technical analysis, is a temporary reversal of an existing trend, either upwards or downwards. It's a brief period where the price of a financial instrument—such as a stock, cryptocurrency, or commodity—decreases in an uptrend or increases in a downtrend, before resuming the original trend. It is essential to note that a pullback does not signify a trend change, merely a pause.
The first step in identifying a pullback is to understand the prevailing trend—whether it is bullish (upward) or bearish (downward). In an uptrend, prices generally make higher highs and higher lows, while in a downtrend, prices make lower highs and lower lows. A pullback occurs when there's a temporary reversal of this pattern. This can be identified through the use of technical indicators such as the Relative Strength Index (RSI), Moving Averages, and volume indicators, or by using trendlines and support/resistance levels.
Both pullbacks and reversals involve counter-trend price movements, but their implications differ. Pullbacks are temporary pauses in the existing trend, after which the price resumes its original direction. In contrast, reversals signify a fundamental shift in the market's direction. After a reversal, the price moves in the opposite direction of the initial trend.
Some strategies for trading pullbacks include the classic pullback strategy, breakout pullback strategy, and moving average pullback strategy. The classic pullback strategy involves entering the market after a pullback within a clear trend. The breakout pullback strategy involves trading when the price breaks a significant support or resistance level and then pulls back to it. The moving average pullback strategy uses moving averages to identify potential pullbacks.
The limitations and challenges of trading pullbacks include the risk of misidentifying a market reversal as a pullback, the difficulty of timing a pullback accurately for market entry or exit, the occurrence of false signals from technical indicators, increased volatility, emotional stress, and increased transaction costs. Despite these challenges, with appropriate knowledge and a disciplined approach, pullbacks can provide profitable trading opportunities.
True Tamplin is a published author, public speaker, CEO of UpDigital, and founder of Finance Strategists.
True is a Certified Educator in Personal Finance (CEPF®), author of The Handy Financial Ratios Guide, a member of the Society for Advancing Business Editing and Writing, contributes to his financial education site, Finance Strategists, and has spoken to various financial communities such as the CFA Institute, as well as university students like his Alma mater, Biola University, where he received a bachelor of science in business and data analytics.
To learn more about True, visit his personal website or view his author profiles on Amazon, Nasdaq and Forbes.


