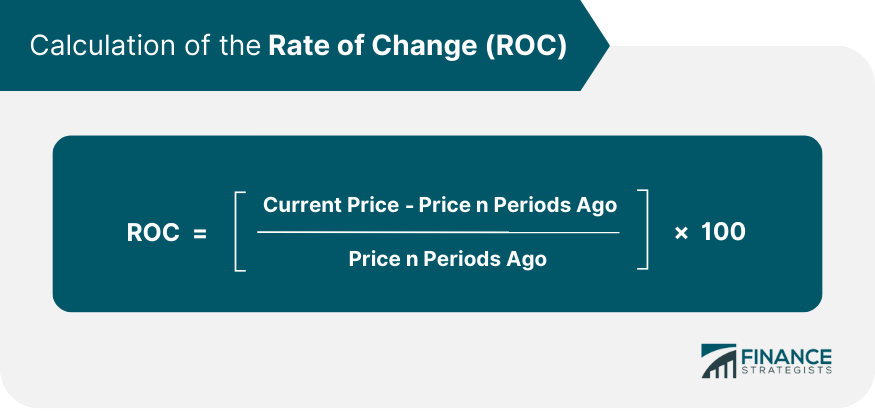
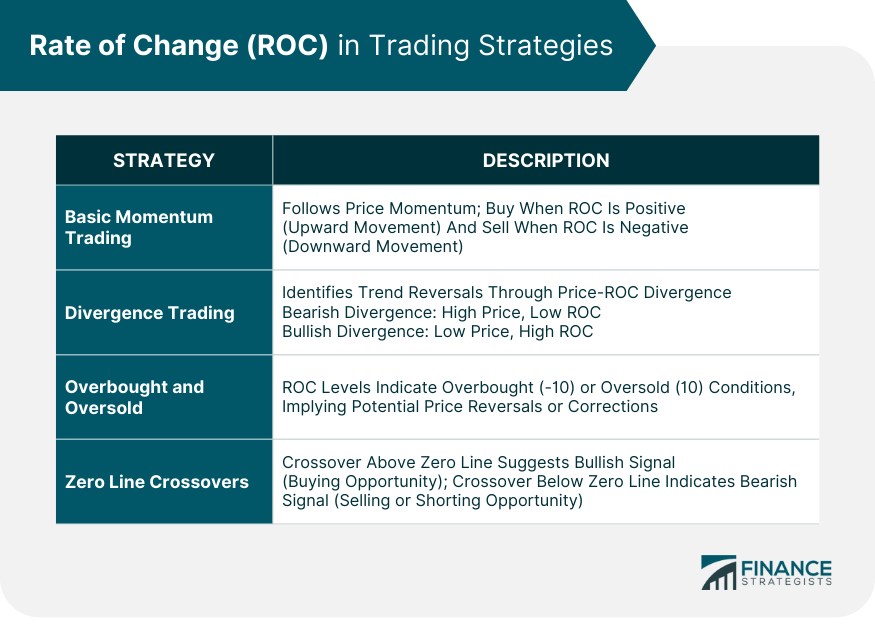
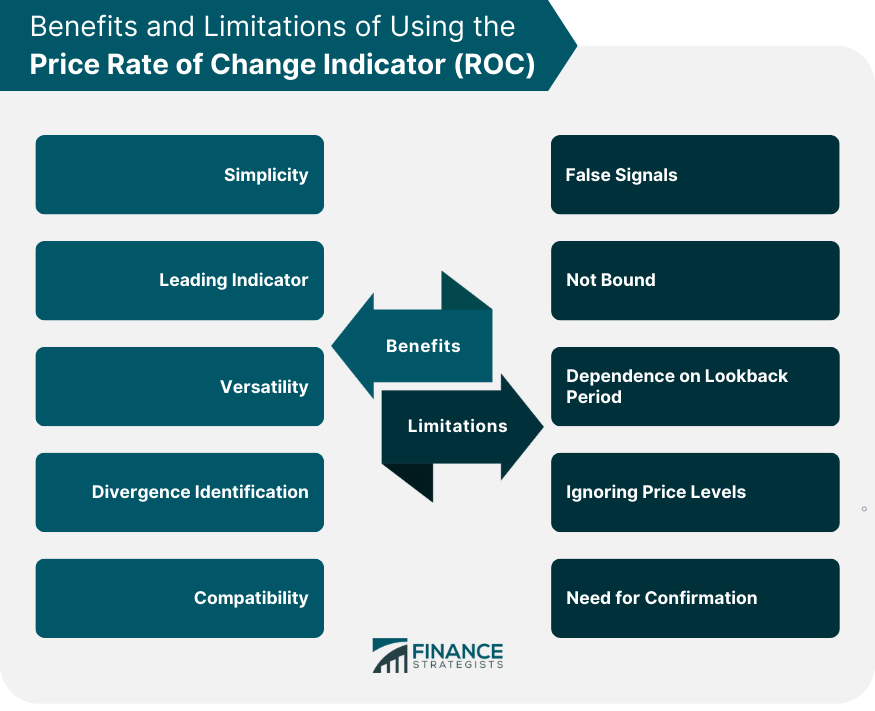
The Price Rate of Change Indicator is a versatile momentum oscillator used in technical analysis to gauge the speed at which a price is changing. It measures the percentage change in price over a specific time period, offering valuable insights to traders about the strength of a price trend. ROC operates on the principle that momentum changes precede price changes. By comparing the current price with the price a certain number of periods ago, ROC serves as a leading indicator. If the ROC is rising, it suggests an increase in momentum and potentially a bullish market scenario. Conversely, a falling ROC could indicate a decrease in momentum, hinting at a bearish market scenario. Calculating ROC involves a simple formula: This formula provides the percentage representation of the price change over the specified period. ROC relies on the assumption that markets trend. If the market is ranging or chaotic, ROC might produce misleading signals. Interpreting ROC is straightforward. Positive values indicate upward momentum, and the larger the number, the stronger the momentum. Negative values suggest downward momentum. The Price Rate of Change Indicator can be applied in various trading strategies. By examining the momentum of a price trend, ROC aids in determining when to enter or exit a trade, the possible reversal points, and the strength of the market. In basic momentum trading, ROC provides traders with a direct line of sight to the velocity of price changes. If the ROC is positive, it signifies that prices are moving upward, suggesting a possible buying opportunity. If the ROC is negative, prices are trending downward, indicating it might be a good time to sell. This strategy is straightforward: follow the momentum. Traders buy when the ROC is rising and sell when the ROC is falling. It's essential to note that this strategy works best in trending markets, where momentum changes correspond with the direction of the trend. Divergence happens when the price of an asset and the ROC are moving in opposite directions. This divergence can often signal an upcoming reversal of price trends. For instance, if the price of an asset reaches a new high, but the ROC doesn't, this bearish divergence could be an indication of a future downward price movement. Conversely, if the price of the asset hits a new low, but the ROC doesn't follow suit, this bullish divergence could signal an upcoming upward price swing. Although ROC doesn't have fixed upper or lower bounds, traders often set their levels that signal overbought or oversold conditions. For example, if the ROC rises above 10, it may indicate that the asset is overbought, and a price reversal might be impending. On the other hand, if the ROC falls below -10, the asset might be oversold, hinting at a potential upward price correction. The zero line represents a point where the current price and the price from 'n' periods ago are equal, meaning no change in price. A crossing above the zero line can be interpreted as a bullish signal, suggesting it might be an opportune time to buy. On the other hand, a move below the zero line can be viewed as a bearish signal, indicating it might be time to sell or short. The indicator's calculation is straightforward, involving a simple percentage change formula. This simplicity extends to its interpretation. A positive ROC indicates an upward momentum, while a negative ROC suggests downward momentum. This clarity can be particularly beneficial for novice traders who are still familiarizing themselves with technical indicators. It means ROC provides signals before a new trend or reversal occurs. This attribute is invaluable for traders as it allows them to anticipate potential price movements before they happen, providing an edge in their trading decisions. ROC can be applied across different markets - stocks, commodities, forex, etc., and various timeframes, whether short-term day trading charts or long-term investment charts. This flexibility makes it a valuable tool for many different trading and investing styles. ROC is excellent at identifying divergences. A divergence between the ROC and price may indicate a potential trend reversal. This early warning can allow traders to adjust their positions accordingly and protect their investments. Another key benefit of ROC is its compatibility with other technical analysis tools. Traders can use ROC alongside trend lines, chart patterns, or other technical indicators to confirm signals and increase the accuracy of their predictions. For example, using ROC in conjunction with a moving average indicator can help traders verify the strength of a trend. ROC, like other momentum oscillators, can produce false signals. This usually occurs in sideways, non-trending markets where the price might oscillate back and forth, causing the ROC to provide misleading buy or sell signals. Another limitation of ROC is that it is not bound to a specific range. Unlike some oscillators that oscillate between 0 and 100 or -100 and 100, ROC can go to theoretically any number. This lack of boundaries can make it difficult to identify overbought and oversold conditions reliably. ROC's sensitivity to the chosen lookback period can also be a limitation. Different lookback periods can produce vastly different results, and there's no universally optimal period. The best choice often depends on the individual asset and the overall market conditions, requiring traders to experiment and adapt. ROC focuses on the momentum of price changes, not the price levels themselves. While this focus makes it excellent for analyzing momentum, it may miss critical price levels or chart patterns that other types of analysis might catch. Due to the aforementioned limitations, ROC signals often need confirmation from other indicators or tools to increase reliability. Solely relying on ROC for trading decisions could lead to misinterpretations and potential losses. ROC is often compared with other momentum oscillators such as the Relative Strength Index (RSI) and the Moving Average Convergence Divergence (MACD). ROC measures the rate of change in price – the velocity of movement – providing a clear, straightforward signal of increasing or decreasing momentum. In contrast, RSI is a bounded oscillator that measures speed and change of price movements to determine overbought or oversold conditions. While ROC's simplicity in interpretation might be appealing, RSI can provide clearer signals in certain market conditions due to its bounded nature. MACD, another momentum indicator, provides information about the relationship between two moving averages of a security's price. MACD can be more complex but can also offer more nuanced insights, including trend direction and duration, and overbought or oversold conditions. While ROC focuses purely on price changes, MACD's use of moving averages makes it less sensitive to sudden price changes. While ROC can provide valuable insights, it's often beneficial to use it in conjunction with other technical indicators to confirm signals and increase trading strategy effectiveness. For instance, ROC can be paired with a simple moving average (SMA) to verify trend signals. A trader might look for the ROC to show increasing momentum in the direction of the trend, confirmed by the price remaining above (for an uptrend) or below (for a downtrend) the SMA. ROC can also be combined with indicators like RSI to spot potential trend reversals. For example, if ROC shows a growing bullish momentum (rising ROC), but the RSI indicates the asset is overbought, it might be a warning signal of an upcoming price reversal. Volume indicators, like On Balance Volume (OBV), can complement ROC as well. Increasing momentum confirmed by growing trading volume can strengthen the signal's reliability. Remember, no single technical indicator should be used in isolation. Each indicator provides a piece of the puzzle, and they often work best when used together. ROC, with its focus on price momentum, can be an integral part of this combined approach, contributing to a more comprehensive understanding of market behavior. The Price Rate of Change Indicator is a valuable tool in technical analysis for traders seeking to gauge the speed of price changes and identify potential market trends. As a leading indicator, ROC provides insights into momentum shifts before price movements occur. It offers simplicity in calculation and interpretation, making it accessible to novice traders. Additionally, ROC's versatility allows it to be applied across various markets and timeframes, enhancing its usefulness for different trading and investing styles. However, it is important to acknowledge the limitations of ROC, including the potential for false signals in non-trending markets, its lack of boundaries, and its sensitivity to the chosen lookback period. Traders are advised to use ROC in conjunction with other indicators and tools to confirm signals and improve the reliability of their trading decisions. When combined with other technical indicators, ROC can be even more powerful. Comparisons with similar indicators like RSI and MACD highlight the distinct advantages and limitations of each indicator. By incorporating ROC into a comprehensive analysis that considers multiple indicators, traders can gain a deeper understanding of market behavior and make more informed trading decisions.What Is the Price Rate of Change Indicator (ROC)?
Theoretical Framework of ROC
Calculation of ROC

Assumptions and Interpretation
ROC in Trading Strategies
Basic Momentum Trading
Divergence Trading
Overbought and Oversold Levels
Zero Line Crossovers

Benefits of Using ROC
Simplicity
Leading Indicator
Versatility
Divergence Identification
Compatibility
Limitations of Using ROC
False Signals
Not Bound
Dependence on Lookback Period
Ignoring Price Levels
Need for Confirmation

ROC and Other Technical Indicators
Comparison With Similar Indicators
Using ROC in Conjunction With Other Indicators
Final Thoughts
Price Rate of Change Indicator (ROC) FAQs
A positive ROC value suggests upward momentum in price. The larger the positive value, the stronger the momentum, indicating a possible buying opportunity.
ROC is more effective in trending markets where momentum changes align with the direction of the trend. In non-trending or sideways markets, ROC may produce misleading signals and should be used with caution.
ROC can identify divergences between the price and the indicator. If the price reaches a new high while the ROC does not, it may indicate a bearish divergence and a potential downward price movement. Conversely, a bullish divergence occurs when the price hits a new low while the ROC does not, suggesting a potential upward price swing.
ROC can produce false signals in non-trending markets, and its lack of boundaries makes it challenging to identify overbought and oversold conditions. The sensitivity to the chosen lookback period can also be a limitation, as different periods may yield different results. Additionally, ROC focuses on price momentum and may overlook critical price levels or chart patterns that other types of analysis consider. Traders are advised to use ROC in conjunction with other indicators and tools to confirm signals and enhance reliability.
Yes, ROC can be applied to various timeframes, making it suitable for both short-term and long-term trading strategies. Short-term traders can use ROC to identify quick momentum shifts for timely entry and exit points, while long-term investors can utilize ROC to gauge the strength and sustainability of a price trend over an extended period. The flexibility of ROC allows traders to adapt it to their preferred trading style and time horizon.
True Tamplin is a published author, public speaker, CEO of UpDigital, and founder of Finance Strategists.
True is a Certified Educator in Personal Finance (CEPF®), author of The Handy Financial Ratios Guide, a member of the Society for Advancing Business Editing and Writing, contributes to his financial education site, Finance Strategists, and has spoken to various financial communities such as the CFA Institute, as well as university students like his Alma mater, Biola University, where he received a bachelor of science in business and data analytics.
To learn more about True, visit his personal website or view his author profiles on Amazon, Nasdaq and Forbes.


