
A Pivot Point is a popular technical analysis tool used by traders to determine the overall market trend over different time periods. The main aim of a pivot point is to provide a kind of 'predictive indicator', presenting an idea of where the market's support and resistance levels are likely to be in the next trading session. The pivot point itself is simply the average of the high, low, and closing prices from the previous trading day. On the subsequent day, trading above the pivot point is thought to indicate ongoing bullish sentiment, while trading below the pivot point indicates bearish sentiment. Pivot Points play an important role in technical analysis, providing a quick way to gauge potential price action. These pivot points are critical for traders' decisions, as they can hint at when to enter or exit a trade, set stop losses, or when to expect increased volatility. Pivot points can also provide confirmation when used in conjunction with other technical indicators. The pivot point is calculated using the high (H), low (L), and close (C) from the previous trading period. The calculation for the standard pivot point (P) is as follows: P = (H + L + C) / 3 In addition to the pivot point, traders also calculate support and resistance levels. To wit: First Resistance (R1) = (2P) - L First Support (S1) = (2P) - H Second Resistance (R2) = P + (R1-S1) Second Support (S2) = P - (R1-S1) Interpreting the results of a pivot point analysis is straightforward. If the price opens above the pivot point, this is a bullish signal, and the trader should consider long positions. Conversely, if the price opens below the pivot point, this suggests bearish sentiment, and the trader might consider short positions. Support and resistance levels further refine this analysis. For example, if the price approaches R1 but fails to break through and falls, it could be a selling opportunity. If it breaks through R1, however, it might continue to rise until it meets resistance at R2. The standard pivot point is the most basic and commonly used pivot point. This is calculated as explained above, using the high, low, and closing price of the previous trading period. Fibonacci pivot points are a variation of the standard pivot points that integrate Fibonacci levels. The central pivot point (P) is calculated in the same way as the standard pivot point. However, the support and resistance levels are then calculated using Fibonacci retracement levels (38.2%, 61.8%, and 100%) around the pivot point. Demark pivot points were developed by Tom Demark. They are different from the standard pivot point and Fibonacci pivot points because they take into account the relationship between the opening and closing prices. Woodie's pivot points give more weight to the closing price of the previous period. They use a different calculation for the pivot point and the support and resistance levels, considering the open, high, low, and close, but with the closing price being used twice in the formula. Camarilla pivot points were developed by Nick Scott in 1989. They include more levels of support and resistance than the standard pivot point, giving traders more potential trading opportunities. If the market price is above the pivot point, this suggests bullish sentiment. Traders may look to open long positions or close short positions. The resistance levels (R1, R2, etc.) can act as targets for taking profits. If the price breaks through a resistance level, this can signal that the bullish trend is strong and may continue. If the market price is below the pivot point, this suggests bearish sentiment. Traders may look to open short positions or close long positions. The support levels (S1, S2, etc.) can act as targets for taking profits. If the price breaks through a support level, this can signal that the bearish trend is strong and may continue. Pivot points are particularly useful in short-term trading, where the goal is to capitalize on small price movements. Traders may set buy orders just above a pivot point level if the trend is bullish or sell orders just below if the trend is bearish. Conversely, a trader could place a stop-loss order just below a support level or just above a resistance level. This can help protect against unexpected market reversals. While pivot points are commonly used in day trading, they can also be helpful in long-term strategies. By applying pivot points on weekly or monthly charts, investors can gain insight into longer-term support and resistance levels. These levels might provide useful entry and exit points for longer-term trades or investments. Pivot points are powerful when used in combination with other technical analysis tools. For instance, a trader might use pivot points in conjunction with trendline analysis, moving averages, or oscillators like the Relative Strength Index (RSI) or MACD. When multiple indicators suggest the same trading signal, this can provide extra confidence in the trading decision. While pivot points can provide insight into potential future price movements, they are unable to predict major market changes. Unpredictable events, such as economic news releases or changes in market sentiment, can dramatically shift the market in a way that pivot points did not anticipate. Like any technical analysis tool, pivot points can sometimes generate false signals. For instance, the price might briefly break through a pivot level, causing a trader to open a position, only to quickly reverse and move in the opposite direction. Pivot points work best in trending markets, where the price is making consistent higher highs or lower lows. In range-bound or choppy markets, pivot points may be less useful. While pivot points are relatively simple to calculate and understand, they require experience to use effectively. Traders must be able to accurately interpret the signals they provide and integrate them with other forms of technical analysis. Since pivot points are calculated using the previous day’s data, they may not always be accurate if the market conditions change rapidly. Traders need to be cautious while using them during high volatility. Pivot points are widely recognized and utilized tools in technical analysis that provide valuable insights into market trends and support/resistance levels. Traders can effectively gauge market sentiment, make informed trading decisions, and set appropriate entry and exit points using pivot points. They can be combined with other technical indicators for confirmation and used in both short-term and long-term trading strategies. However, it is crucial to acknowledge the limitations of pivot points, including their inability to predict major market changes and the potential for false signals in certain market conditions. Traders should exercise caution, rely on their experience, and integrate pivot points with other forms of analysis to maximize their effectiveness. What Is a Pivot Point?
How the Pivot Point Works
Mathematical Calculation
Interpretation
Types of Pivot Points
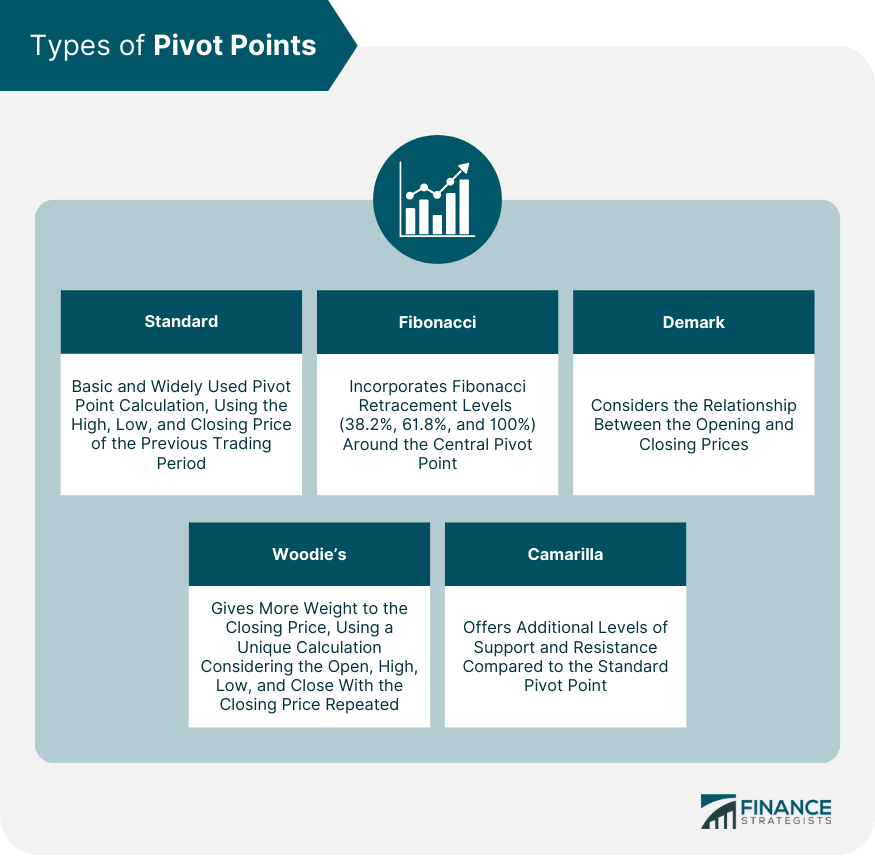
Standard
Fibonacci
Demark
Woodie’s
Camarilla
Pivot Point in Market Sentiment Analysis
Bullish Sentiment
Bearish Sentiment
How to Use Pivot Points in Trading
Short-Term Trading
Long-Term Investment
Integrating With Other Tools
Risks and Limitations of Using Pivot Points
Inability to Predict Major Market Changes
False Signals
Not Suitable for All Market Conditions
Requires Experience to Use Effectively
Dependence on Previous Day’s Data
Final Thoughts
Pivot Point FAQs
Yes, pivot points can be used in long-term investing strategies. By applying pivot points on weekly or monthly charts, investors can identify key support and resistance levels over longer timeframes. These levels can serve as valuable entry and exit points for longer-term trades or investments.
Pivot points may be less effective in highly volatile markets. Rapid changes in market conditions can render pivot points less accurate since they are calculated based on the previous day's data. Traders should exercise caution and consider the reliability of the calculations during periods of high volatility.
Pivot points can be used as a standalone indicator, providing valuable insights into market trends and potential price levels. However, many traders prefer to use pivot points in conjunction with other technical analysis tools, such as trendlines, moving averages, or oscillators, to confirm signals and increase confidence in their trading decisions.
Pivot points can be applied to various financial markets, including stocks, forex, commodities, and indices. However, their effectiveness may vary depending on the market's characteristics and trading patterns. Traders should consider the specific dynamics of each market and adapt their pivot point strategies accordingly.
There are several types of pivot points, including the standard pivot point, Fibonacci pivot points, Demark pivot points, Woodie's pivot points, and Camarilla pivot points. Each type uses a slightly different calculation method, which may align better with specific trading strategies or market conditions.
True Tamplin is a published author, public speaker, CEO of UpDigital, and founder of Finance Strategists.
True is a Certified Educator in Personal Finance (CEPF®), author of The Handy Financial Ratios Guide, a member of the Society for Advancing Business Editing and Writing, contributes to his financial education site, Finance Strategists, and has spoken to various financial communities such as the CFA Institute, as well as university students like his Alma mater, Biola University, where he received a bachelor of science in business and data analytics.
To learn more about True, visit his personal website or view his author profiles on Amazon, Nasdaq and Forbes.


