
A pennant is a price pattern used by traders to predict future price movements. It is identified by a large price move, followed by a consolidation period, which takes the form of a small symmetrical triangle. This consolidation is the pennant. It's usually characterized by reducing trading volumes and denotes a pause in the existing trend before its continuation. The pennant pattern finds its roots in Dow Theory, a fundamental concept in technical analysis. Charles Dow, the co-founder of the Dow Jones Industrial Average, laid the groundwork for these patterns, though the specific terminology of "pennant" was not used until later. It was subsequent technicians who recognized the unique properties of these small consolidations and named them due to their resemblance to pennants in the real world. The pennant pattern is a crucial tool as it allows traders to anticipate future price movements. Recognizing these patterns provides traders with an edge in their trading strategies, as pennants are often a signal that the current trend—either upward (bullish) or downward (bearish)—will continue after a brief period of consolidation. A pennant pattern is identified by two main components: the flagpole and the pennant itself. The flagpole represents a swift, near-vertical price movement, followed by the pennant, a small symmetrical triangle that forms as the price consolidates. This triangle consists of converging trendlines with declining volume, typically found at the midpoint of a large price movement. While pennants and flags are similar, they differ in shape and duration. Flag patterns are rectangular, with trend lines that run parallel, while pennants are small symmetrical triangles. The consolidation period for a flag pattern is longer, often spanning several weeks, while a pennant will generally last between one and three weeks. Bullish and bearish pennants hint at the continuation of an existing trend. A bullish pennant forms during an uptrend, characterized by a sharp price rise (the flagpole), followed by a downward sloping consolidation (the pennant). Conversely, a bearish pennant forms during a downtrend, with a sharp price drop forming the flagpole, followed by an upward sloping consolidation period. In both cases, the trend is expected to continue once the price breaks out of the pennant. To identify a pennant pattern, traders look for a sharp price move on significant volume, forming the flagpole. This should be followed by a period of consolidation, forming the pennant, where trading volume tapers off. The trend lines of this consolidation period should converge. Pennant patterns are typically horizontal or slightly sloped against the preceding trend. They appear at the midpoint of the larger price move, and their breakout is usually in the direction of the initial move. Volume plays a vital role, declining during the formation of the pennant, and expanding during the breakout. Common mistakes in identifying pennant patterns include confusing them with other chart patterns, such as triangles or wedges. The distinction lies in the context—pennants occur after a significant price movement and are followed by a breakout in the same direction. Another mistake is neglecting to consider volume, an essential factor in confirming the pattern. Bullish pennants can be a signal to enter a long position or add to an existing one. Traders often set a buy order above the pennant's upper trend line, expecting the price to resume its upward momentum once the breakout occurs. Bearish pennants, conversely, signal potential for a downward price move. Traders might enter a short position or sell existing holdings. A sell order can be set below the pennant's lower trend line, anticipating the price will continue to fall once the breakout happens. Like any trading strategy, trading on pennant patterns involves risk. Traders should set stop-loss orders to manage potential losses if the price does not move as expected. Moreover, while pennant patterns are reliable, they are not foolproof; hence, their signals should be used in conjunction with other technical analysis tools. Identifying a pennant pattern requires some subjective interpretation of the price chart. Traders may have different opinions on the shape and boundaries of the pattern, leading to variations in their analysis. This subjectivity can introduce a level of uncertainty and make it challenging to achieve consistent and reliable results. Pennant patterns, like any other technical analysis tool, are not infallible. They can produce false signals, indicating a potential price continuation when the market is actually reversing or moving sideways. Relying solely on pennant patterns without considering other factors or confirming indicators may lead to poor trading decisions. Pennant patterns can vary significantly in terms of their duration. Some patterns may form over a few hours, while others might take several weeks. The sensitivity to the timeframe can affect the accuracy of the pattern and the subsequent price movement. Traders need to be aware of the timeframe they are analyzing and consider its impact on the reliability of the pattern. Pennant patterns are developed based on historical price data, assuming that the market conditions remain relatively stable. However, real markets are influenced by a multitude of factors, including economic news, geopolitical events, and market sentiment. These external factors can disrupt the pattern's effectiveness, making it less reliable in volatile or unpredictable market conditions. While pennant patterns can suggest a potential price continuation in the direction of the previous trend, they do not provide a precise prediction of the magnitude or duration of the movement. The patterns offer a probabilistic outlook rather than an exact forecast, making it important for traders to combine them with other technical indicators or fundamental analysis for a more comprehensive assessment. Markets are complex and often exhibit multiple patterns simultaneously or in rapid succession. Pennant patterns may overlap with other chart patterns, such as triangles or wedges, which can complicate their interpretation and reduce their effectiveness. Traders should consider the broader context and analyze multiple patterns and indicators to gain a clearer picture of market dynamics. Technical analysis patterns, including pennants, may not work equally well across all markets, assets, or timeframes. The reliability and effectiveness of these patterns can vary depending on the specific characteristics of the instrument being analyzed. Traders need to evaluate the historical performance and applicability of pennant patterns to their chosen market before placing significant reliance on them. Pennants are price patterns used by traders in technical analysis to predict future price movements. They consist of a flagpole, which represents a sharp price move, followed by a consolidation period known as the pennant. Pennants can be bullish or bearish, indicating the continuation of an existing trend. Identifying a pennant pattern involves looking for a significant volume spike during the flagpole formation, followed by a decrease in volume during the pennant consolidation. The breakout from the pennant should be confirmed by an increase in volume. Traders can employ various strategies based on pennant patterns, such as entering long or short positions depending on the trend. However, there are limitations to relying solely on pennant patterns for trading decisions, including subjectivity, false signals, timeframe sensitivity, market assumptions, limited predictive power, overlapping patterns, and lack of universal application. Traders need to evaluate the historical performance and applicability of pennant patterns to their specific market before making significant trading decisions. It is best to use pennants in conjunction with other technical indicators for a more nuanced analysis.What Is a Pennant?
Structure of a Pennant
Components
Pennant vs Flag Patterns
Bullish and Bearish Pennants
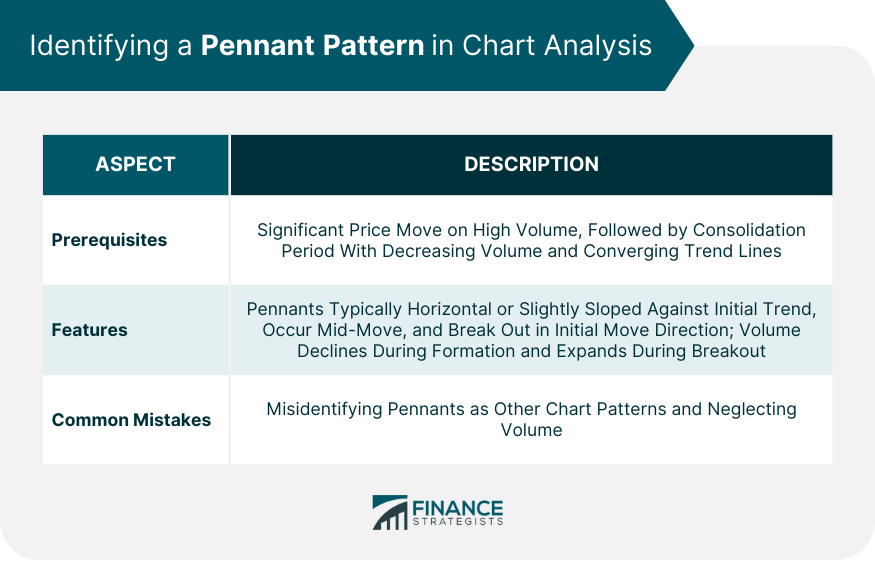
Identifying a Pennant Pattern in Chart Analysis
Prerequisites
Features
Common Mistakes
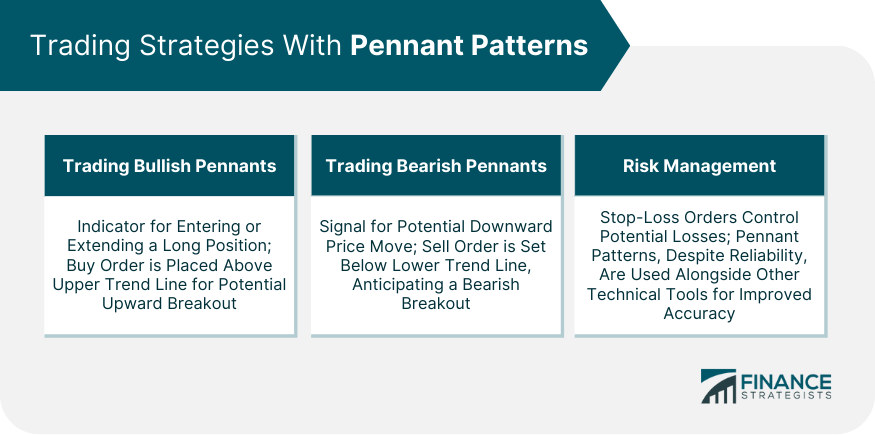
Trading Strategies With Pennant Patterns
Trading Bullish Pennants
Trading Bearish Pennants
Risk Management
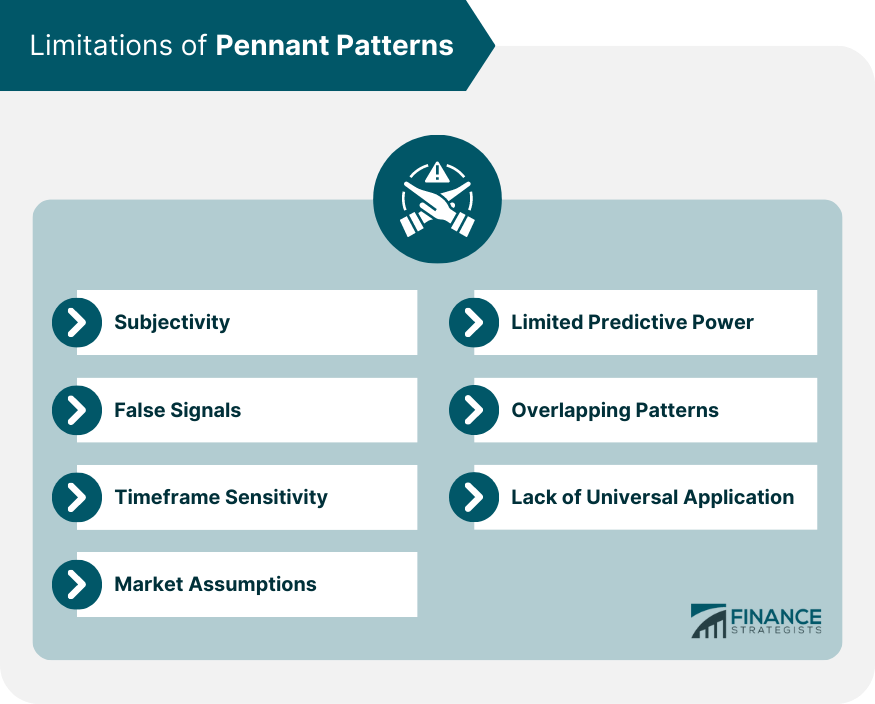
Limitations of Pennant Patterns
Subjectivity
False Signals
Timeframe Sensitivity
Market Assumptions
Limited Predictive Power
Overlapping Patterns
Lack of Universal Application
Final Thoughts
Pennant FAQs
Distinguishing a pennant pattern involves considering its context. Pennants occur after a significant price movement and are followed by a breakout in the same direction. Triangles or wedges, on the other hand, may have different characteristics and do not necessarily follow a sharp price move.
Yes, like any technical analysis tool, pennant patterns can produce false signals. They may indicate a potential price continuation when the market is actually reversing or moving sideways. It is important to consider other factors and confirming indicators to avoid relying solely on pennant patterns.
Pennant patterns can vary in duration. Some may form over a few hours, while others might take several weeks. The timeframe sensitivity can affect the accuracy of the pattern and subsequent price movement.
Pennant patterns may not work equally well across all markets, assets, or timeframes. Their reliability and effectiveness can vary depending on the specific characteristics of the instrument being analyzed. Traders should evaluate the historical performance and applicability of pennant patterns to their chosen market.
No, pennant patterns offer a probabilistic outlook rather than precise predictions. While they suggest a potential price continuation in the direction of the previous trend, they do not provide specific information about the magnitude or duration of the movement. It is advisable to combine them with other technical indicators or fundamental analysis for a more comprehensive assessment.
True Tamplin is a published author, public speaker, CEO of UpDigital, and founder of Finance Strategists.
True is a Certified Educator in Personal Finance (CEPF®), author of The Handy Financial Ratios Guide, a member of the Society for Advancing Business Editing and Writing, contributes to his financial education site, Finance Strategists, and has spoken to various financial communities such as the CFA Institute, as well as university students like his Alma mater, Biola University, where he received a bachelor of science in business and data analytics.
To learn more about True, visit his personal website or view his author profiles on Amazon, Nasdaq and Forbes.


