
The Negative Directional Indicator is a technical analysis tool used to measure the downward price momentum in a financial market. It provides traders and analysts with insight into the strength of a downtrend in the price of an asset. Developed by J. Welles Wilder Jr., the Directional Movement System comprises the -DI, Positive Directional Indicator (+DI), and the Average Directional Index (ADX). These indicators are calculated from the differences in the highest and lowest prices over a given period. The Directional Movement System is designed to help traders identify the strength and direction of price movements, making it an essential tool in trend-following strategies. The -DI is based on the concept of "directional movement," defined by Wilder as the largest part of the current period's price range that lies outside the previous period's price range. When the price moves downwards, and the low of the current period is lower than the low of the previous period, this is considered a negative directional movement. The more significant this negative movement, the higher the value of -DI, indicating a stronger downward trend. The calculation of -DI involves several steps. First, the directional movement (DM) for each period is determined. The negative DM is the amount by which the low of the current period exceeds the low of the previous period. If there's no increase in the low, or if the high of the current period exceeds the high of the previous period, the negative DM is zero. Next, the negative DMs over a specified number of periods (often 14) are summed and averaged, then divided by the Average True Range (ATR) for those periods, and multiplied by 100 to give a percentage. The result is the -DI. The Negative Directional Indicator plays a pivotal role in identifying downward trends in a market. When the -DI line rises, it signals that the bearish force, or selling pressure, in the market is increasing. This information can be instrumental to traders looking to capitalize on declining prices. When paired with the +DI, which measures upward price momentum, it provides a comprehensive view of market direction. In trading, the -DI serves as a valuable guide for making informed decisions. When the -DI line crosses above the +DI line, it generates a signal that sellers are overpowering buyers—suggesting that it may be an opportune time to sell or go short. Conversely, when the -DI line falls below the +DI line, it indicates that selling pressure is easing, which might suggest a forthcoming bullish phase. Typically, a -DI value above 25 indicates strong selling pressure, while a value below 20 may suggest weak selling pressure. A rising -DI line signifies increasing bearish momentum, and a declining -DI line indicates weakening bearish momentum. However, interpreting the -DI in isolation can lead to misjudgments. It's often best to consider -DI in relation to +DI and ADX to have a more holistic view of the market conditions. When used alongside price action analysis, the -DI can provide additional insights. For instance, if prices are making new lows but the -DI fails to make new highs, it can be a sign of divergence—indicating the selling pressure may be diminishing despite lower prices. This could suggest a potential reversal in price direction. In the Directional Movement System, the interaction between -DI and +DI is crucial. When -DI crosses above +DI, it signifies a bearish or selling signal. On the other hand, when +DI crosses above -DI, it is considered a bullish or buying signal. ADX, another integral part of the Directional Movement System, measures the strength of the trend regardless of its direction. When ADX is above 25, it indicates a strong trend, while a value below 20 suggests a weak trend. If the ADX is high and the -DI is above the +DI, it may indicate a strong downtrend. Conversely, if the ADX is low while -DI is above +DI, it could mean that the bearish sentiment is not particularly strong. The Negative Directional Indicator can be effectively combined with other technical analysis tools to enhance the accuracy of trading signals. For instance, pairing the -DI with a momentum indicator like the Relative Strength Index (RSI) could help traders identify potential overbought or oversold conditions in a downtrending market. Similarly, integrating the -DI with volume-based indicators can provide insights into the strength of selling pressure in the market. The -DI can also be integrated into risk management strategies. For instance, traders may choose to tighten stop-loss levels when the -DI increases significantly, implying heightened selling pressure. On the other hand, if the -DI decreases, traders might consider trailing their stop losses to protect potential profits in case of a trend reversal. Conducting a multi-timeframe analysis with the -DI can be advantageous. This involves analyzing the -DI across different timeframes (daily, weekly, monthly) to gain a broader perspective of the market's directional movement. For example, if the -DI is rising across all timeframes, it may indicate a strong and consistent bearish trend across short, medium, and long-term periods. The -DI can also help identify potential market divergences and overbought/oversold conditions. For instance, if the asset price is making new lows, but the -DI isn't rising correspondingly, it can suggest a bullish divergence—potentially indicating a weakening downtrend and a forthcoming bullish reversal. Like all technical indicators, the -DI has its limitations and is not foolproof. One of the primary scenarios where the -DI may be ineffective is during a ranging market or in the absence of a strong trend. In these instances, the -DI may generate misleading signals. The -DI can sometimes produce false signals, suggesting a strong downtrend when one is not present or vice versa. Traders must employ additional confirmation tools, like other technical indicators or chart patterns, to filter out these false signals and enhance the accuracy of their predictions. While certain values of -DI are generally interpreted as indicating strong or weak selling pressure, these thresholds are not absolute. What might be considered a high -DI value in one market could be viewed differently in another. This variability can pose a challenge in interpreting -DI values. The effectiveness of -DI is also tied to the accurate calculation of ADX. Any errors in computing the ADX can affect the -DI values and lead to incorrect trading decisions. Traders must ensure the correctness of their calculations to get the most out of the -DI. The Negative Directional Indicator is a valuable tool in technical analysis that provides insights into the downward price momentum and strength of a downtrend in a financial market. When used in conjunction with other indicators, such as the Positive Directional Indicator (+DI) and the Average Directional Index (ADX), it can help traders identify market trends and make informed trading decisions. However, it is important to recognize the limitations and challenges associated with using the -DI. It may generate misleading signals in ranging markets or during the absence of a strong trend, and false signals can occur, requiring additional confirmation tools. Additionally, the interpretation of -DI values can vary across different markets, and accurate calculation of ADX is essential for reliable -DI readings. Advanced concepts related to the -DI include conducting multi-timeframe analysis to gain a broader perspective of market trends and identifying divergences and overbought/oversold conditions. By understanding these factors and employing proper risk management techniques, traders can leverage the -DI effectively as part of their overall trading approach.What Is the Negative Directional Indicator (-DI)?
How the Negative Directional Indicator Works
Basis of -DI
Calculating the -DI
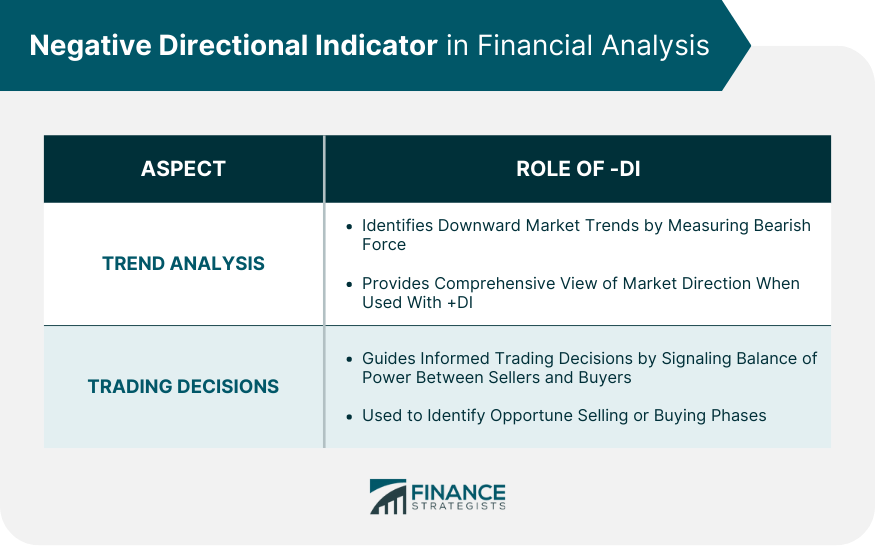
Negative Directional Indicator in Financial Analysis
Trend Analysis
Trading Decisions
Reading and Interpreting the Negative Directional Indicator
Understanding -DI Values
-DI and Price Action Analysis
Negative Directional Indicator and the Average Directional Index (ADX)
Relation Between -DI and +DI
Significance of ADX in Conjunction With -DI
Negative Directional Indicator in Trading Strategies
Pairing -DI With Other Technical Indicators
Incorporating -DI Into Risk Management
Advanced Concepts Related to Negative Directional Indicators
Multi-Timeframe Analysis
Overbought/Oversold Conditions and Divergences
Limitations and Challenges of Using the Negative Directional Indicator
Ineffective in Certain Situations
Potential False Signals
Challenges in Interpreting -DI Values
Dependence on Accurate Calculation of ADX
Final Thoughts
Negative Directional Indicator (-DI) FAQs
The -DI is a crucial tool in technical analysis as it measures the downward price momentum and strength of a downtrend in a financial market. It helps traders identify bearish trends, signaling increasing selling pressure. By considering the -DI in conjunction with other indicators, traders can gain insights into market direction and make informed trading decisions.
The -DI can be effectively combined with other technical indicators to enhance the accuracy of trading signals. For example, pairing it with momentum indicators like the Relative Strength Index (RSI) can help identify potential overbought or oversold conditions. Integrating the -DI with volume-based indicators provides insights into the strength of selling pressure. Additionally, incorporating the -DI into risk management strategies, such as adjusting stop-loss levels based on -DI readings, can help traders protect profits and manage risks.
Yes, like any technical indicator, the -DI can produce false signals. It may indicate a strong downtrend when one is not present or vice versa. To mitigate this, traders should employ additional confirmation tools, such as other technical indicators or chart patterns, to filter out false signals and increase the accuracy of their predictions.
Yes, the -DI has limitations. It may be ineffective in ranging markets or when a strong trend is absent. In such cases, the -DI may generate misleading signals. Additionally, interpreting -DI values can vary across different markets, and accurate calculation of the Average Directional Index (ADX) is crucial for reliable -DI readings. Traders should be aware of these limitations and consider them when utilizing the -DI.
The -DI is often used in conjunction with the Positive Directional Indicator (+DI) and the Average Directional Index (ADX). The interaction between -DI and +DI can provide signals for bearish or bullish trends when one crosses above the other. When combined with the ADX, which measures the strength of a trend, traders can gain a more comprehensive view of market conditions. By analyzing these indicators together, traders can make more informed trading decisions based on the direction and strength of price movements.
True Tamplin is a published author, public speaker, CEO of UpDigital, and founder of Finance Strategists.
True is a Certified Educator in Personal Finance (CEPF®), author of The Handy Financial Ratios Guide, a member of the Society for Advancing Business Editing and Writing, contributes to his financial education site, Finance Strategists, and has spoken to various financial communities such as the CFA Institute, as well as university students like his Alma mater, Biola University, where he received a bachelor of science in business and data analytics.
To learn more about True, visit his personal website or view his author profiles on Amazon, Nasdaq and Forbes.


