Moving averages are widely used technical indicators that help smooth out price data by creating a constantly updated average price. They are employed to identify trends in financial markets and assist investors in making informed decisions. In the context of wealth management, moving averages can be valuable tools for market analysis, risk management, and asset allocation. There are several types of moving averages, each with its unique calculation method and application. The most common types are: The SMA is the most basic type of moving average. It is calculated by taking the arithmetic mean of a given set of prices over a specific period. The Exponential Moving Average gives more weight to recent prices, reducing the lag found in the SMA. This makes the EMA more responsive to price fluctuations, which can be beneficial in fast-moving markets. The Weighted Moving Average assigns a weight to each data point based on its age, giving more importance to recent data points. The WMA is also more responsive to price changes than the SMA. The HMA is an advanced type of moving average designed to reduce lag and improve smoothing. It combines the best aspects of the simple, weighted, and exponential moving averages. Moving averages can be used to analyze market trends and identify potential investment opportunities. They help in understanding the direction of the market by providing information on the following: A rising moving average indicates an uptrend, while a falling moving average suggests a downtrend. Investors can use this information to make buy or sell decisions in line with the prevailing trend. When a moving average changes direction, it can signal a potential trend reversal. Investors can capitalize on this information to adjust their portfolios and make timely investment decisions. Moving averages can act as dynamic support and resistance levels, helping investors identify entry and exit points for their trades. Moving averages can be used as a risk management tool in wealth management by helping investors set stop-loss orders and determine the risk/reward ratio of their investments. Investors can use moving averages to set stop-loss orders, which help limit losses in case the market moves against their position. By analyzing the distance between the current price and the moving average, investors can assess the potential risk and reward of trade, enabling them to make informed decisions. Moving averages can aid in asset allocation and diversification by identifying potential investments and monitoring asset performance. Investors can use moving averages to screen for assets that exhibit strong trends, which can then be added to their portfolios. By comparing the performance of individual assets to their moving averages, investors can gauge the relative strength of their holdings and adjust their portfolios accordingly. The moving average crossover strategy is a popular technique that involves using two moving averages with different timeframes. A golden cross occurs when a short-term moving average crosses above a long-term moving average, signaling a potential bullish trend. A death cross happens when a short-term moving average crosses below a long-term moving average, indicating a potential bearish trend. The Moving Average Convergence/Divergence is a momentum indicator that calculates the difference between two moving averages (usually 12-day and 26-day EMAs) and compares it to a signal line (usually a 9-day EMA of the MACD). When the MACD crosses above the signal line, it suggests a bullish trend, and when it crosses below, it indicates a bearish trend. Bollinger Bands are a technical analysis tool that uses a set of three lines: a simple moving average and two standard deviation lines above and below the moving average. These bands help identify overbought or oversold conditions, potential trend reversals, and periods of increased market volatility. The triple moving average strategy uses three moving averages with different timeframes (short-term, medium-term, and long-term) to generate buy or sell signals. This strategy aims to capture trends and reduce false signals by considering multiple moving averages. Moving averages are lagging indicators, which means they are based on historical data and may not always accurately predict future price movements. Investors should be aware of this limitation and consider using additional technical indicators to improve their analysis. Whipsaw signals refer to the false buy or sell signals generated by moving averages when the market is moving sideways or is highly volatile. To mitigate the impact of whipsaw signals, investors can use other technical indicators or adopt a longer time horizon for their moving averages. While moving averages can provide valuable insights, they should not be used in isolation. Investors should consider using additional technical indicators, such as Relative Strength Index (RSI), Stochastic Oscillator, or Average True Range (ATR), to enhance their analysis and decision-making process. Moving averages are essential tools for market analysis, risk management, and asset allocation. There are several types of moving averages, each with unique calculation methods and applications, including SMA, EMA, WMA, and HMA. Moving averages can help investors identify market trends, act as dynamic support and resistance levels, and assist in setting stop-loss orders to limit losses. They can also aid in asset allocation and diversification by identifying potential investments with strong trends and assessing the relative strength of holdings. Different moving average strategies, such as the moving average crossover, MACD, Bollinger Bands, and triple moving average strategy, can help generate buy or sell signals. However, investors should also consider limitations such as the lagging nature of moving averages, whipsaw signals, and the need to use complementary technical indicators.Definition of Moving Averages
Types of Moving Averages
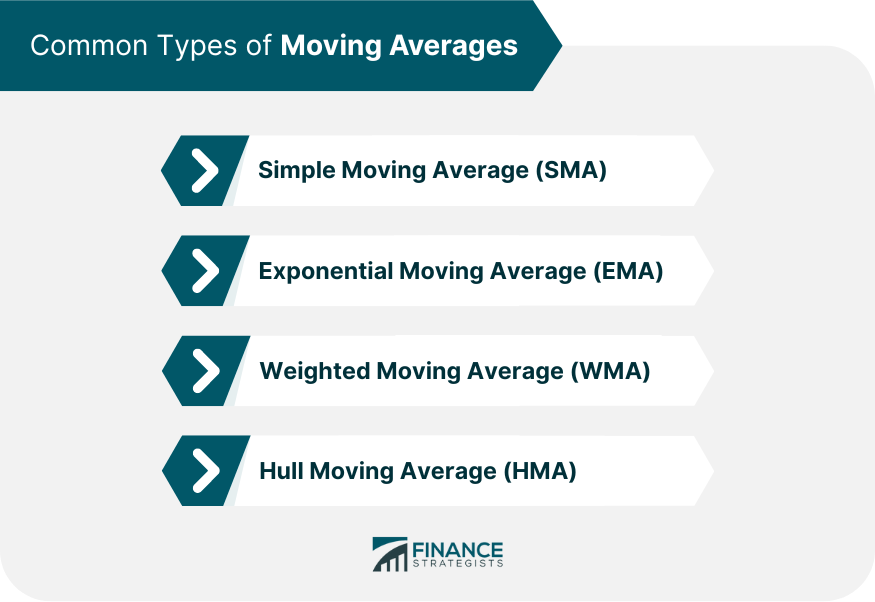
Simple Moving Average (SMA)
Exponential Moving Average (EMA)
Weighted Moving Average (WMA)
Hull Moving Average (HMA)
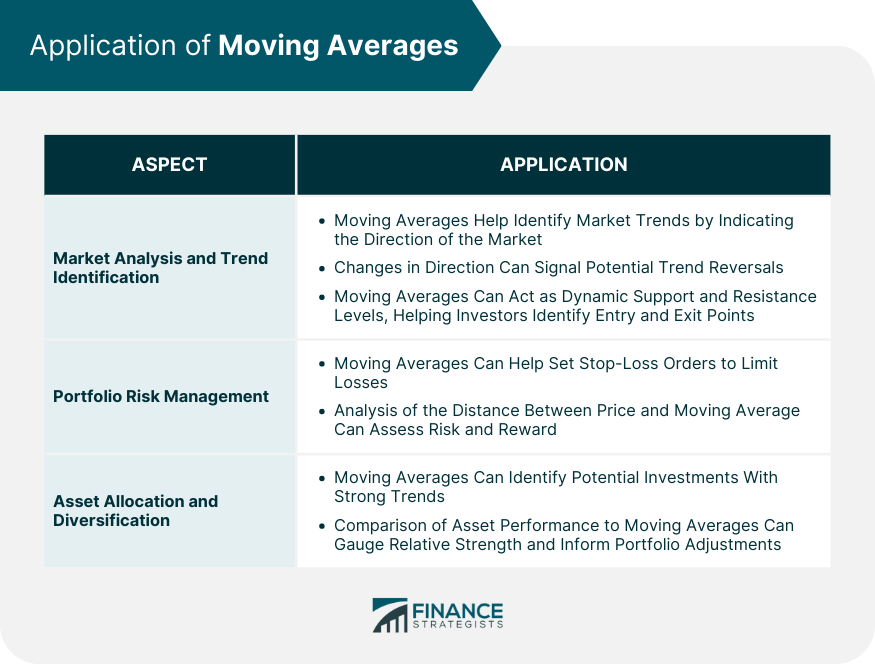
Application of Moving Averages
Market Analysis and Trend Identification
Portfolio Risk Management
Asset Allocation and Diversification
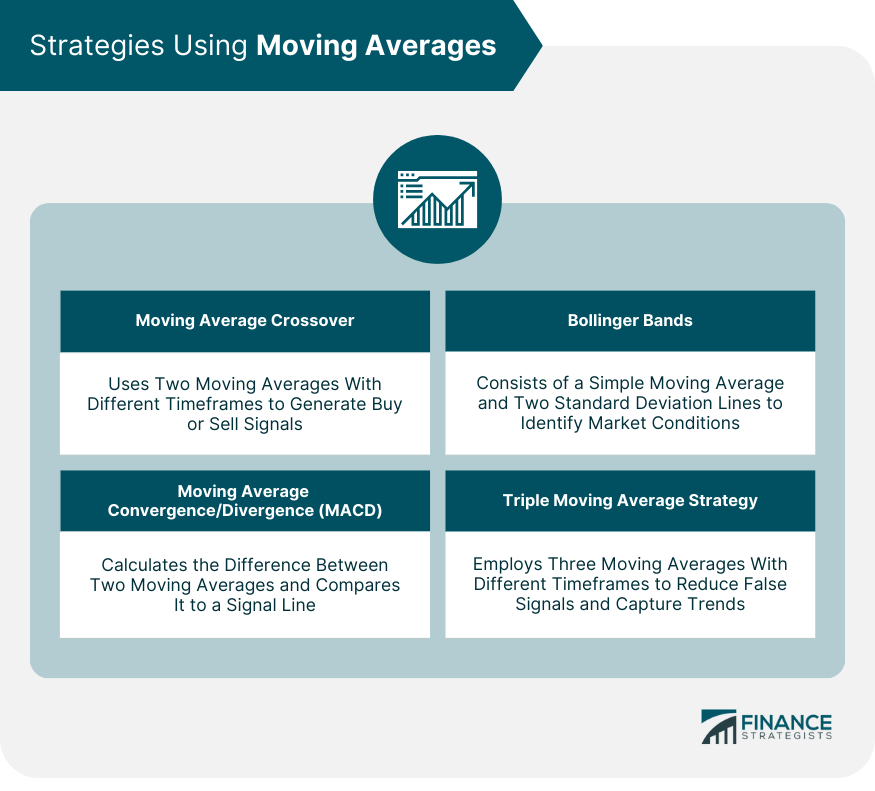
Strategies Using Moving Averages
Moving Average Crossover Strategy
Golden Cross
Death Cross
Moving Average Convergence/Divergence (MACD)
Bollinger Bands
Triple Moving Average Strategy
Limitations and Considerations of Moving Averages
Lagging Nature of Moving Averages
Whipsaw Signals
Complementary Technical Indicators
Bottom Line
Moving Averages FAQs
There are four common types of moving averages used in wealth management: Simple Moving Average (SMA), Exponential Moving Average (EMA), Weighted Moving Average (WMA), and Hull Moving Average (HMA). Each type has its unique calculation method and application, providing various insights into market trends and investment opportunities.
Moving averages can help identify market trends by smoothing out price data and providing a constantly updated average price. A rising moving average indicates an uptrend, while a falling moving average suggests a downtrend. Additionally, moving averages can signal potential trend reversals and act as dynamic support and resistance levels.
Some popular strategies using moving averages in wealth management include the moving average crossover strategy (golden cross and death cross), Moving Average Convergence/Divergence (MACD), Bollinger Bands, and the triple moving average strategy. These strategies help investors capitalize on market trends, manage risk, and make informed investment decisions.
The limitations of using moving averages in wealth management include their lagging nature, the occurrence of whipsaw signals, and the need for complementary technical indicators. To overcome these limitations, investors should consider using additional technical indicators and adapting their strategies based on prevailing market conditions.
Moving averages can help in portfolio risk management by providing insights into stop-loss orders and risk/reward ratios. They can also assist in asset allocation and diversification by identifying potential investments and monitoring asset performance. By comparing individual assets to their moving averages, investors can gauge the relative strength of their holdings and adjust their portfolios accordingly.
True Tamplin is a published author, public speaker, CEO of UpDigital, and founder of Finance Strategists.
True is a Certified Educator in Personal Finance (CEPF®), author of The Handy Financial Ratios Guide, a member of the Society for Advancing Business Editing and Writing, contributes to his financial education site, Finance Strategists, and has spoken to various financial communities such as the CFA Institute, as well as university students like his Alma mater, Biola University, where he received a bachelor of science in business and data analytics.
To learn more about True, visit his personal website or view his author profiles on Amazon, Nasdaq and Forbes.