
The line of best fit, also known as the trend line, is a statistical tool utilized in data analysis. It represents the relationship between two variables on a scatter plot by drawing a straight line that best fits the data points. This line tries to minimize the distance between each data point and the line itself, helping to predict future data values. The line of best fit is particularly significant in the realm of technical analysis. Technical analysis focuses on analyzing market activity, including price and volume, to predict future trends. Utilizing the line of best fit allows analysts to discern the underlying trend amid market noise, providing valuable insights that can potentially lead to profitable trading opportunities. Within technical analysis, the line of best fit, or trend line, often denotes support and resistance levels. Support is a price level where an asset's price tends to stop falling because demand surpasses supply, whereas resistance is a price level where the asset's price typically stops rising because supply exceeds demand. Identifying these levels can help traders make informed decisions. The line of best fit serves as a crucial tool in technical analysis. It assists in spotting trends and patterns in the price data, making it easier to predict future price movements. Moreover, it can help to identify when a trend is about to reverse, offering a signal to buy or sell. This approach, while simplistic, allows for a more tactile understanding of price trends. You essentially plot the points on a chart and then use a ruler to find a line that seems to best fit those points. In modern times, computer software and algorithms are often used to draw the line of best fit. Various financial software packages can perform this function automatically, taking into account every price point and using mathematical methods to determine the best fit. Despite advances in technology, human judgment remains integral to the process of drawing the line of best fit. Analysts must interpret the data, considering factors like market conditions, outlier data points, and individual company circumstances. The Line of Best Fit helps to identify underlying trends in the data set. For instance, in stock market analysis, it can showcase whether a particular stock price is generally increasing, decreasing, or following a random pattern over a certain period. This trend information is crucial for investors and traders to devise their investment strategies. By understanding the direction and strength of the trend, investors can make educated predictions about where the price might go next. While it doesn't guarantee future performance, it does provide a statistically likely scenario that can guide investment decisions. In financial markets, making timely decisions is crucial. The Line of Best Fit serves as a visual aid for decision-making processes, especially in technical analysis, where it's crucial to identify buy and sell signals. It can help investors decide when to enter or exit the market to optimize returns and minimize losses. By highlighting the overall direction of market trends, it can help traders and investors understand the potential downside and adjust their strategies accordingly. This understanding can be particularly helpful in volatile markets, where price fluctuations can pose significant risks. Financial markets generate vast amounts of data. The Line of Best Fit can simplify this data, making it more accessible and understandable. By reducing the data to a single trendline, it can help investors and analysts see the bigger picture without getting lost in the details. Traders gauge the efficiency of their strategies by juxtaposing the forecasted trend with the actual outcome. Based on this analysis, they can make the required modifications to their strategies. The Line of Best Fit is sensitive to extreme values in a data set. An outlier can significantly alter the slope and position of the line, leading to potentially misleading conclusions. While outliers can sometimes provide valuable insights, they can also distort the overall trend, making it crucial to handle them carefully. The Line of Best Fit typically assumes a linear relationship between two variables. However, this isn't always the case in real-world data, particularly in financial markets where price movements can be influenced by a multitude of factors. When relationships between variables are non-linear or more complex, the Line of Best Fit might not provide an accurate representation of the trend. Although the Line of Best Fit can simplify complex data, overreliance on it can lead to oversimplification. Financial markets are influenced by a wide range of factors, including economic events, policy changes, investor sentiment, and more. By focusing solely on the trend line, investors might overlook other important factors that could impact market trends. While the Line of Best Fit can provide useful predictions about future trends, it's important to remember that these predictions are based on past data. Past performance doesn't guarantee future results, particularly in volatile markets. Furthermore, the line can't account for unforeseen events, such as economic crises or major policy changes, that can drastically affect market trends. The Line of Best Fit is most effective when used in combination with other tools and techniques, such as fundamental analysis, technical indicators, and economic forecasting. Relying solely on the Line of Best Fit for decision-making can lead to an incomplete understanding of the market. In the stock market, analysts use the line of best fit to identify trends in stock prices and predict future movements. For example, by applying the line of best fit to a scatter plot of a company's stock prices over time, an analyst could anticipate a potential increase or decrease in the stock's value. In the foreign exchange (Forex) market, the line of best fit is used to interpret currency value fluctuations. For instance, by plotting the exchange rate between the U.S. dollar and the euro over a period, an analyst could use the line of best fit to predict future exchange rate trends. Commodity traders also utilize the line of best fit. By applying it to historical data on commodity prices, such as oil or gold, they can forecast future price movements, informing trading decisions and potential profit-making opportunities. The line of best fit refers to a straight line that is drawn on a scatter plot of price data to represent the underlying trend or direction of the data points. It is a valuable tool in financial and technical analysis. It assists in identifying underlying trends, forecasting price movements, supporting decision-making processes, managing risk, simplifying complex data, and validating trading strategies. However, it has certain drawbacks, including sensitivity to outliers, the assumption of a linear relationship, the potential for oversimplification, and limitations in predicting future trends. It is essential to use the line of best fit judiciously, in conjunction with other analytical tools, to make informed investment decisions. The line of best fit can be applied in various areas of financial analysis, such as stock market analysis, forex markets, and commodity trading. To make the most of the Line of Best Fit and ensure accurate and informed investment decisions, it is essential to seek professional advice. Consulting with financial analysts, advisors, or experts can provide valuable insights and guidance tailored to individual investment goals and risk tolerance.What Is the Line of Best Fit?
Understanding the Line of Best Fit in Technical Analysis
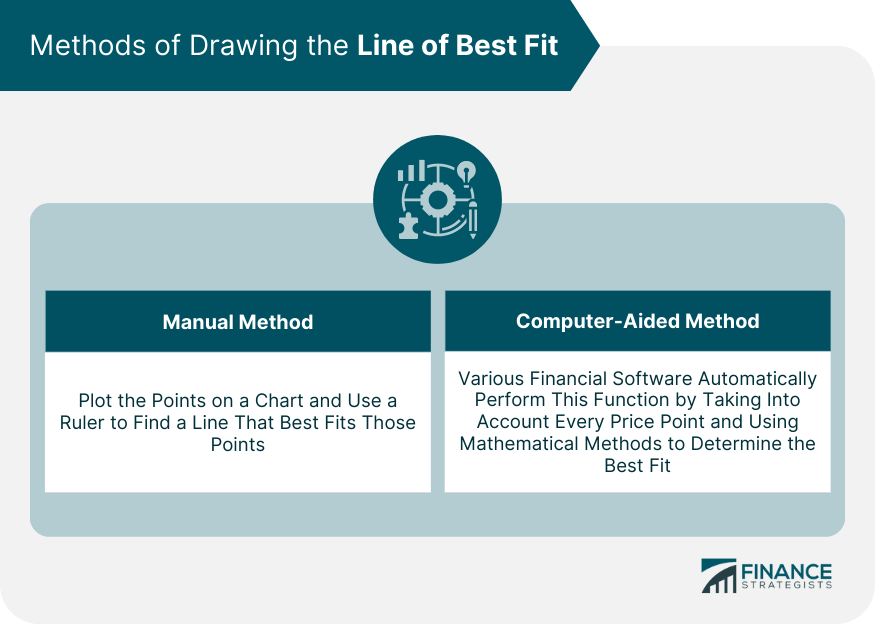
Methods of Drawing the Line of Best Fit
Manual Method: Using Price Points and a Ruler
Computer-Aided Method: Using Financial Software and Algorithms
Role of Human Judgment and Experience
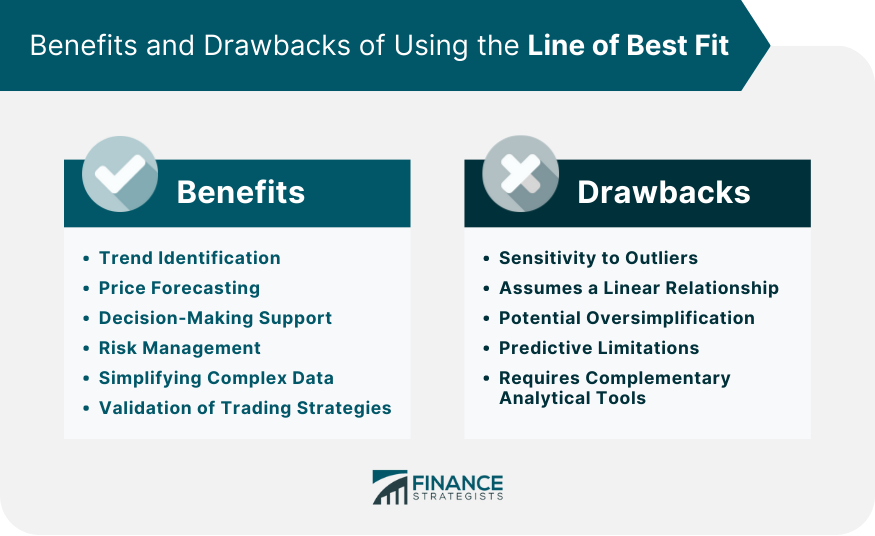
Benefits of Using the Line of Best Fit
Trend Identification
Price Forecasting
Decision-Making Support
Risk Management
Simplifying Complex Data
Validation of Trading Strategies
Drawbacks of Using the Line of Best Fit
Sensitivity to Outliers
Assumes a Linear Relationship
Potential Oversimplification
Predictive Limitations
Requires Complementary Analytical Tools
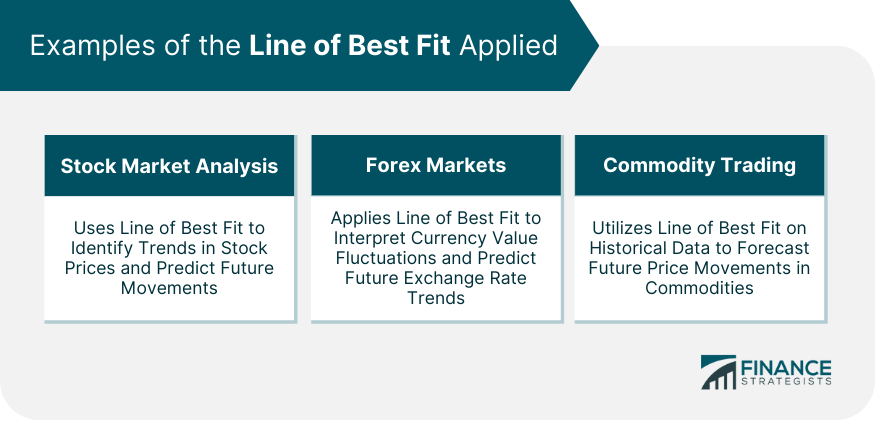
Examples of the Line of Best Fit Applied
Stock Market Analysis
Forex Markets
Commodity Trading
Final Thoughts
Line of Best Fit FAQs
The Line of Best Fit is used to represent the relationship between two variables on a scatter plot, helping to identify trends and predict future data values.
While the Line of Best Fit provides statistical insights, it is important to remember that past performance does not guarantee future results. Unforeseen events and complex market dynamics can impact trends.
Outliers can significantly influence the slope and position of the line, potentially leading to misleading conclusions. It is crucial to handle outliers carefully and consider their impact on the overall trend.
The Line of Best Fit assumes a linear relationship between variables, which may not accurately represent the trend in real-world data. Non-linear relationships require alternative methods of analysis.
No, the Line of Best Fit is just one tool among many in financial analysis. It is most effective when used in combination with other tools and techniques to gain a comprehensive understanding of the market.
True Tamplin is a published author, public speaker, CEO of UpDigital, and founder of Finance Strategists.
True is a Certified Educator in Personal Finance (CEPF®), author of The Handy Financial Ratios Guide, a member of the Society for Advancing Business Editing and Writing, contributes to his financial education site, Finance Strategists, and has spoken to various financial communities such as the CFA Institute, as well as university students like his Alma mater, Biola University, where he received a bachelor of science in business and data analytics.
To learn more about True, visit his personal website or view his author profiles on Amazon, Nasdaq and Forbes.


