
The Harami Cross is a candlestick pattern used in wealth management to identify potential trend reversals. "Harami" means pregnant in Japanese, indicating that the pattern represents a small candlestick within the body of a larger candlestick. It suggests a potential shift in market sentiment from bullish to bearish or vice versa. The Harami Cross pattern is significant in wealth management as it provides traders and investors with a visual representation of a potential trend reversal. By recognizing the Harami Cross pattern and understanding its implications, traders can make informed decisions about market entry and exit points, manage their risk effectively, and optimize their trading strategies. The Harami Cross pattern serves as a valuable tool in technical analysis, helping traders identify potential turning points and adjust their positions accordingly. It highlights potential areas of support and resistance, allowing for more accurate predictions of future price movements. The Harami Cross pattern consists of two candlesticks: a larger one that represents the previous trend and a smaller one that is contained within the body of the larger candlestick. The smaller candlestick is often referred to as the "harami" candlestick. In a bullish Harami Cross pattern, the larger candlestick is bearish, indicating a downward trend, while the smaller candlestick is bullish, suggesting a potential reversal. Conversely, in a bearish Harami Cross pattern, the larger candlestick is bullish, indicating an upward trend, while the smaller candlestick is bearish, signaling a potential reversal. To identify the Harami Cross pattern on a price chart, traders look for the specific characteristics described earlier. They analyze the relationship between the larger and smaller candlesticks, paying attention to their size, shape, and position. In a bullish Harami Cross pattern, the smaller bullish candlestick is completely contained within the body of the larger bearish candlestick. This signifies a potential shift from bearish to bullish sentiment. Conversely, in a bearish Harami Cross pattern, the smaller bearish candlestick is contained within the body of the larger bullish candlestick. This indicates a potential shift from bullish to bearish sentiment. By recognizing and interpreting the Harami Cross pattern correctly, traders can gain insights into potential trend reversals and adjust their trading strategies accordingly. A bullish Harami Cross pattern suggests a potential reversal from a downtrend to an uptrend. It occurs when the smaller bullish candlestick is contained within the body of the larger bearish candlestick. This indicates a decrease in selling pressure and a potential increase in buying interest. Traders interpret the bullish Harami Cross as a signal to consider long positions or to add to existing long positions. It suggests that the market sentiment is shifting towards bullishness, and the potential for upward price movement may present profitable opportunities. A bearish Harami Cross pattern indicates a potential reversal from an uptrend to a downtrend. It occurs when the smaller bearish candlestick is contained within the body of the larger bullish candlestick. This suggests a decrease in buying pressure and a potential increase in selling interest. Traders interpret the bearish Harami Cross as a signal to consider short positions or to exit existing long positions. It suggests that the market sentiment is shifting towards bearishness, and the potential for downward price movement may present profitable opportunities. By understanding and interpreting the bullish and bearish Harami Cross patterns, traders can make informed decisions about their trading positions and manage their portfolios effectively. The Harami Cross pattern is considered a reversal signal as it suggests a potential shift in market sentiment. In both the bullish and bearish Harami Cross patterns, the smaller candlestick represents a potential reversal of the previous trend. In a bullish Harami Cross, the smaller bullish candlestick indicates a decrease in selling pressure and a potential increase in buying interest. This suggests that the previous downtrend may be losing momentum, and a reversal towards an uptrend is possible. In a bearish Harami Cross, the smaller bearish candlestick indicates a decrease in buying pressure and a potential increase in selling interest. This suggests that the previous uptrend may be losing momentum, and a reversal towards a downtrend is possible. Traders use the Harami Cross pattern as a signal to consider potential trend reversals and adjust their trading strategies accordingly. While the Harami Cross pattern provides valuable insights into potential trend reversals, traders should consider several factors to make informed trading decisions. Confirmation from other technical indicators or chart patterns can strengthen the validity of the Harami Cross pattern. Traders often look for additional signs of support or resistance, volume analysis, or the confirmation of other candlestick patterns in conjunction with the Harami Cross pattern. This helps reduce the risk of false signals and increases the reliability of potential reversal signals. Additionally, traders should consider the overall market conditions, the timeframe of the chart, and the presence of any significant news or events that may influence price movements. A comprehensive analysis, incorporating multiple factors, can provide a more accurate assessment of potential trend reversals indicated by the Harami Cross pattern. While the Harami Cross pattern can provide valuable insights into potential trend reversals, it is important to confirm its signals using additional technical indicators or chart patterns. Relying solely on the Harami Cross pattern may lead to false signals and result in poor trading decisions. Traders often use other technical analysis tools, such as trendlines, oscillators, or support and resistance levels, to validate the signals generated by the Harami Cross pattern. This multi-dimensional approach enhances the accuracy of trading decisions and reduces the risk of entering trades solely based on the Harami Cross pattern. Like any technical analysis pattern, the Harami Cross pattern has its limitations and instances where it may not be reliable. In certain market conditions, such as during periods of low trading volume or in highly volatile markets, the signals generated by the Harami Cross pattern may be less reliable. Traders should exercise caution when relying solely on the Harami Cross pattern in such conditions and consider incorporating other technical indicators or analysis techniques to validate potential trading opportunities. Additionally, it is important to consider the context of the pattern within the overall market trend. The Harami Cross pattern may have different implications if it occurs within a strong trend or during a period of consolidation. Traders should assess the pattern in relation to the broader market dynamics to make well-informed trading decisions. The Harami Cross is a candlestick pattern used in wealth management to identify potential trend reversals. It consists of a smaller candlestick contained within the body of a larger candlestick and provides visual cues of a potential shift in market sentiment. While the Harami Cross pattern provides valuable insights, traders should confirm its signals with other technical indicators or chart patterns. They should also consider market conditions, volume analysis, and the presence of significant news or events. The Harami Cross pattern holds significance in investment analysis as it helps traders identify potential trend reversals, adjust their positions, and manage their risk effectively. By recognizing the Harami Cross pattern and considering its implications, traders can optimize their trading strategies and increase the probability of profitable trades.What Is the Harami Cross?
How the Harami Cross Works
Characteristics of the Harami Cross Pattern
Identification of the Harami Cross Pattern on a Price Chart
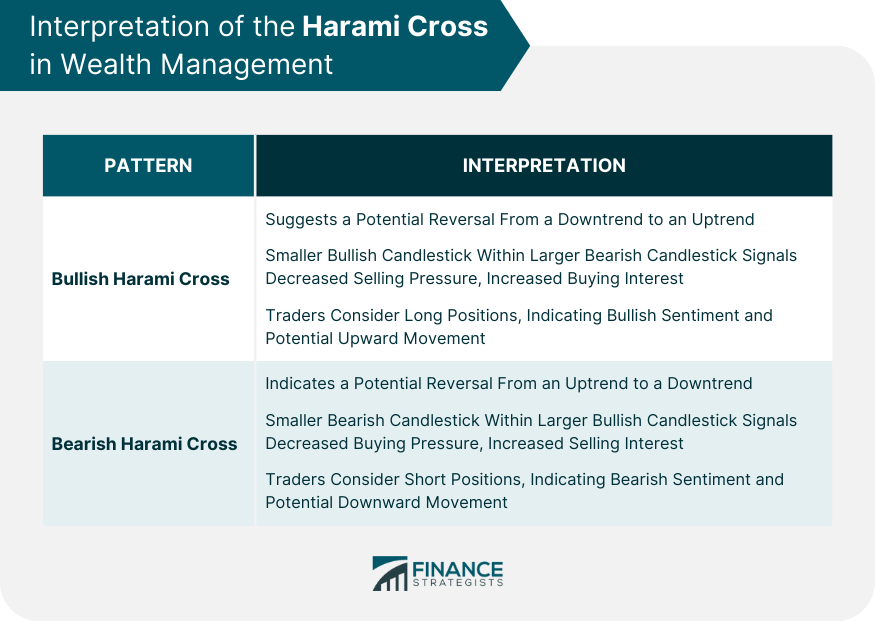
Interpretation of the Harami Cross in Wealth Management
Bullish Harami Cross
Bearish Harami Cross
Harami Cross Pattern as a Reversal Signal
How the Harami Cross Pattern Indicates Potential Trend Reversal
Factors to Consider When Using the Harami Cross Pattern
Limitations and Considerations
Importance of Confirming Signals and Other Technical Indicators
Instances Where the Harami Cross Pattern May Not Be Reliable
Conclusion
Harami Cross FAQs
The Harami Cross pattern is a candlestick pattern that consists of a smaller candlestick contained within the body of a larger candlestick. It indicates a potential trend reversal.
The bullish Harami Cross pattern suggests a potential reversal from a downtrend to an uptrend, while the bearish Harami Cross pattern indicates a potential reversal from an uptrend to a downtrend.
Traders should consider confirming signals from other technical indicators or chart patterns, as well as overall market conditions, timeframe, and the presence of significant news or events.
No, the Harami Cross pattern may not be reliable in certain market conditions, such as low trading volume or highly volatile markets. Traders should exercise caution and consider additional validation techniques.
Harami Cross patterns are important in investment analysis as they provide insights into potential trend reversals, allowing traders to make informed decisions, manage risk effectively, and optimize their trading strategies.
True Tamplin is a published author, public speaker, CEO of UpDigital, and founder of Finance Strategists.
True is a Certified Educator in Personal Finance (CEPF®), author of The Handy Financial Ratios Guide, a member of the Society for Advancing Business Editing and Writing, contributes to his financial education site, Finance Strategists, and has spoken to various financial communities such as the CFA Institute, as well as university students like his Alma mater, Biola University, where he received a bachelor of science in business and data analytics.
To learn more about True, visit his personal website or view his author profiles on Amazon, Nasdaq and Forbes.


