
Derived from a pattern in nature, Fibonacci numbers and lines represent a mathematical concept that is commonly used in technical analysis in various industries. The Fibonacci number series is a sequence where each subsequent number is the sum of the previous two, starting with 0 and 1. Fibonacci lines, often referred to as Fibonacci retracements, are horizontal lines that indicate potential support and resistance levels based on the Fibonacci number series. In wealth management, the Fibonacci numbers and lines have taken a pivotal role. Investors, traders, and financial advisors use these tools to predict potential price movements in the financial markets. They help identify optimal points for entering and exiting trades, thereby increasing the potential for maximizing returns and reducing risks. To understand Fibonacci numbers, we need to revisit the concept as it is defined mathematically. The Fibonacci sequence is a series of numbers where each number is the sum of the two preceding ones, typically starting with 0 and 1. The sequence appears as 0, 1, 1, 2, 3, 5, 8, 13, 21, 34, and so forth. Fascinating properties emerge from the Fibonacci numbers. For example, the ratio of any two consecutive Fibonacci numbers approximates the "golden ratio" of 1.618. This number has been revered for its aesthetically pleasing properties in art and architecture. In the Fibonacci sequence, each number after the first two is about 1.618 times greater than the preceding number, a property that remains constant throughout the sequence. Fibonacci numbers play a vital role in wealth management, particularly in technical analysis and trading. They provide a mathematical basis for creating moving averages and determining price retracements and extensions. These tools help analysts to identify potential trends and reversals in the financial markets, which can guide investment decisions and strategies. Fibonacci lines, often referred to as Fibonacci retracements or extensions, are a tool used in technical analysis to predict potential price levels. Based on the Fibonacci sequence, these lines are plotted horizontally on a chart to indicate possible support and resistance levels. They are commonly drawn at the key Fibonacci levels of 23.6%, 38.2%, 50%, 61.8%, and 100%. The construction of Fibonacci lines involves identifying a significant price movement and then dividing the vertical distance by the key Fibonacci ratios. Once these levels are plotted on a chart, they can provide potential areas of interest for traders. When the price of a security approaches a Fibonacci line, it could be an indication that the price will find support or resistance at that level, informing trading decisions. Fibonacci lines serve as a significant tool in wealth management. They allow financial managers and investors to visualize potential areas of support or resistance on a chart, which can provide valuable insights into market trends. They are often used in conjunction with other forms of technical analysis to maximize the potential for successful trades and to reduce the risk of significant losses. Practical Applications in Wealth Management involve the utilization of Fibonacci tools to enhance decision-making and analysis in financial markets. Fibonacci retracement levels assist in identifying potential support and resistance levels, aiding in determining entry and exit points for investment positions. Fibonacci extensions provide insights into potential price targets beyond the retracement levels, assisting in setting profit targets and managing risk. Fibonacci time zones help in predicting potential market reversals or continuations based on specific time intervals, enabling traders and investors to better time their investment decisions. Additionally, the Fibonacci fan tool, used in practical wealth management applications, helps identify potential support and resistance levels in price trends, allowing for trend analysis and support/resistance identification. The application of these Fibonacci-based techniques empowers wealth managers to make more informed and strategic investment choices. Fibonacci retracement is a popular tool in technical analysis that uses horizontal lines to indicate where potential support and resistance levels may occur. These lines are based on the Fibonacci sequence and are used to predict where a price may experience a retracement, or a temporary reversal in the overarching trend. The application of Fibonacci retracement levels involves identifying a major price move (up or down) and then dividing the vertical distance by the key Fibonacci ratios. These levels are used by traders to identify potential reversal points in the price of an asset. For example, if a stock price has risen significantly, traders might anticipate a retracement at a key Fibonacci level before the price resumes its upward trend. Fibonacci retracements are essential in wealth management, particularly in areas involving market prediction and investment decision-making. Portfolio managers often use them to determine when to buy or sell a security. For instance, if a security’s price is expected to retrace to a certain Fibonacci level before continuing its current trend, a manager might choose to buy or sell at this level to maximize returns. Fibonacci extensions are another tool derived from the Fibonacci sequence. They are used in technical analysis to predict potential areas of resistance or support beyond the 100% level of a price move. They commonly occur at the 161.8%, 261.8% and 423.6% levels. The interpretation of Fibonacci extension levels involves recognizing potential target prices or stop levels. When a price breaks through a 100% retracement level, traders look at the extension levels to get an idea of where the price might go next. These levels can serve as profit targets or potential reversal points. The use of Fibonacci extensions is prevalent in wealth management. They allow for more nuanced predictions of price movements, which can guide investment decisions. This is especially valuable in trending markets, where extensions can help identify when a trend might end or experience significant resistance or support. Fibonacci fans are a charting technique consisting of diagonal lines that use Fibonacci ratios to divide a price and time axis. They are used to identify potential support and resistance levels, as well as to anticipate key price movements. Constructed from a high and low point on the chart, Fibonacci fans are drawn at the key Fibonacci levels of 38.2%, 50%, and 61.8%. These lines project into the future and form an imaginary 'fan.' The interpretation lies in the intersections of these lines with the price, indicating potential areas of support or resistance. In wealth management, Fibonacci fans can add depth to market analysis. These tools can highlight potential areas where market sentiment might shift, impacting the price of a security. By understanding where these potential shifts could occur, wealth managers can optimize their investment strategies, manage risk, and potentially enhance returns. Fibonacci time zones are a technical analysis tool used to predict potential significant price movements based on the Fibonacci sequence. They are vertical lines based on a starting point and the sequence's incrementing values. The application of Fibonacci time zones involves identifying a baseline or a significant price movement and then placing vertical lines on the chart at intervals that correspond to the Fibonacci sequence. When the price approaches these lines, it may signal a significant price change or the beginning of a new trend. In wealth management, understanding Fibonacci time zones can provide an additional layer of insight into market behavior. They can help identify times where significant price changes may occur, thereby informing trading and investment decisions. In this way, wealth managers can better anticipate market movements and adjust their strategies accordingly. The application of Fibonacci numbers and lines significantly enhances technical analysis. They offer a quantifiable approach to predicting price movements, making it easier to identify potentially profitable trades. This leads to improved decision-making, helping wealth managers to more effectively allocate resources. Fibonacci tools provide a method for identifying potential support and resistance levels. Recognizing these levels can give investors an edge by allowing them to anticipate potential price reversals. This can inform entry and exit points, potentially leading to higher returns. The nature of Fibonacci numbers and their application in market analysis can improve the accuracy of market predictions. By providing a mathematical basis for predicting price movements, they can improve the success rate of trades and reduce the likelihood of significant losses. One significant drawback of using Fibonacci numbers and lines is the subjectivity involved in selecting the levels. While the Fibonacci ratios are based on mathematical formulas, the choice of which high and low price points to use can be arbitrary and might differ among analysts. Another limitation is the overreliance on historical price patterns. Fibonacci tools are primarily backward-looking, which means they may not always accurately predict future price movements, particularly in highly volatile or unpredictable markets. Fibonacci tools may be less effective in highly volatile or unpredictable markets. Since these tools rely on historical patterns, sudden market shifts can render predictions based on Fibonacci numbers and lines ineffective. The Fibonacci numbers and lines serve as valuable tools in wealth management. They allow for enhanced technical analysis, improved identification of support and resistance levels, and increased potential for accurate market predictions. However, their effectiveness can be hindered by subjectivity in selecting levels, overreliance on historical price patterns, and ineffectiveness in volatile markets. Despite these limitations, the significance of Fibonacci numbers and lines in wealth management is undeniable. They have proven to be instrumental in aiding wealth managers in making informed decisions that can lead to increased returns and risk mitigation.What Are Fibonacci Numbers and Lines?
Fibonacci Numbers
Definition of Fibonacci Numbers
Properties and Characteristics of Fibonacci Numbers
Application of Fibonacci Numbers in Wealth Management
Fibonacci Lines
Definition of Fibonacci Lines
Construction and Interpretation of Fibonacci Lines
Significance of Fibonacci Lines in Wealth Management
Practical Applications in Wealth Management
Fibonacci Retracement
Definition of Fibonacci Retracement
Application of Fibonacci Retracement Levels
How Fibonacci Retracement is Used in Wealth Management
Fibonacci Extensions
Definition of Fibonacci Extensions
Interpretation of Fibonacci Extension Levels
Utilization of Fibonacci Extensions in Wealth Management
Fibonacci Fans
Definition and Purpose of Fibonacci Fans
Construction and Interpretation of Fibonacci Fans
Role of Fibonacci Fans in Wealth Management
Fibonacci Time Zones
Definition of Fibonacci Time Zones
Application of Fibonacci Time Zones
Importance of Fibonacci Time Zones
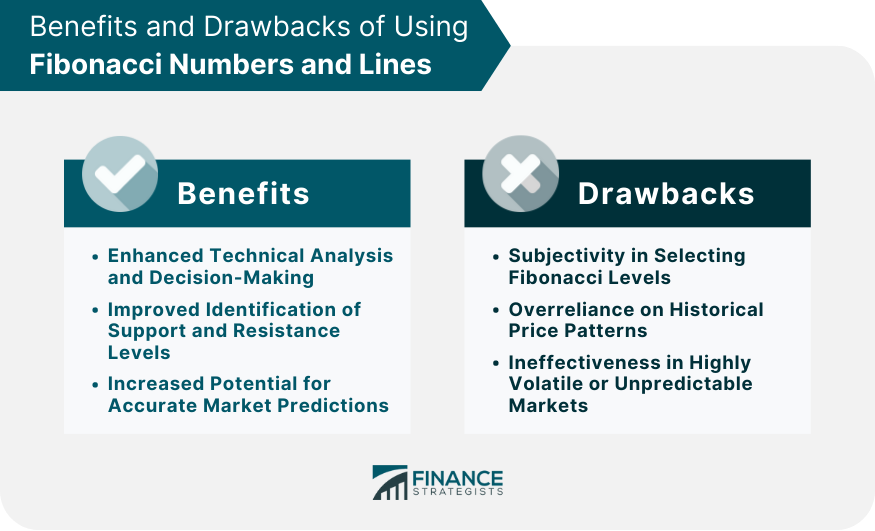
Benefits of Using Fibonacci Numbers and Lines
Enhanced Technical Analysis and Decision-Making
Improved Identification of Support and Resistance Levels
Increased Potential for Accurate Market Predictions
Drawbacks of Fibonacci Numbers and Lines
Subjectivity in Selecting Fibonacci Levels
Overreliance on Historical Price Patterns
Ineffectiveness in Highly Volatile or Unpredictable Markets
Conclusion
Fibonacci Numbers and Lines FAQs
Fibonacci numbers are a sequence of numbers where each number is the sum of the two preceding ones, typically starting with 0 and 1.
Fibonacci lines are horizontal lines based on the Fibonacci sequence. They are used in technical analysis to predict potential areas of support and resistance in a price trend.
A Fibonacci retracement is a tool used in technical analysis to identify potential reversal points in the price of an asset. It uses horizontal lines at key Fibonacci ratios to predict where a price might experience a temporary reversal in its overarching trend.
Fibonacci numbers and lines are used in wealth management to predict potential price movements. They can help identify optimal entry and exit points for trades, provide insights into market trends, and guide investment decisions.
The limitations of using Fibonacci numbers and lines in wealth management include the subjectivity in selecting Fibonacci levels, overreliance on historical price patterns, and their ineffectiveness in highly volatile or unpredictable markets.
True Tamplin is a published author, public speaker, CEO of UpDigital, and founder of Finance Strategists.
True is a Certified Educator in Personal Finance (CEPF®), author of The Handy Financial Ratios Guide, a member of the Society for Advancing Business Editing and Writing, contributes to his financial education site, Finance Strategists, and has spoken to various financial communities such as the CFA Institute, as well as university students like his Alma mater, Biola University, where he received a bachelor of science in business and data analytics.
To learn more about True, visit his personal website or view his author profiles on Amazon, Nasdaq and Forbes.


