
In technical analysis, a bar chart is a graphical representation of price movements for an asset over a specific period of time. It displays four main pieces of information: the opening price, the closing price, the high price, and the low price. Each bar in the chart illustrates four key price points during a specific period. These are often referred to as OHLC (Open, High, Low, Close) charts. The vertical line represents the high and low for the trading period, while the horizontal lines on either side indicate the opening price (left tick) and closing price (right tick). By providing these four data points, the bar chart offers a comprehensive view of the price movement within the chosen timeframe. Interpreting a bar chart requires a sound understanding of both individual bars and sequences of bars. The length of the bar shows the range of the price movement for the given period - a long bar indicates substantial price movement, while a short bar suggests less variability. The position of the opening and closing ticks provides an insight into the price direction. When the closing tick is above the opening tick, it signifies a bullish period (prices rose), and when it's below, it indicates a bearish period (prices fell). Beyond individual bars, the sequence of bars gives further insights. For example, a series of bars with rising lows and highs might suggest an upward trend, while falling lows and highs could hint at a downward trend. Understanding the bar pattern sequences is key to predicting future price movements. Various patterns emerge when bars form together over time. These patterns can be broadly categorized into trending and consolidation patterns. Trending patterns represent the direction of the market. They include: Consolidation patterns suggest periods of indecision in the market. They include: In the realm of trading, bar chart patterns serve as valuable tools for identifying entry and exit points. Traders look for specific patterns to predict whether a security's price is likely to continue or reverse its trend. For instance, if a trader identifies an uptrend, they might choose to buy the security with the expectation that its price will continue to rise. Similarly, bar chart patterns play a crucial role in risk management. Traders can set stop-loss levels based on the patterns they observe. For example, in an uptrend, a trader might set a stop-loss below the most recent low to protect themselves from potential reversals. Bar charts provide a clear and concise visual representation of price action over a specific period. The vertical lines depict the high and low prices, while the horizontal lines indicate the opening and closing prices. This allows traders to quickly interpret the price range, volatility, and direction within each period. Bar charts allow traders to compare price movements across different periods. By observing patterns and trends over time, traders can identify recurring price behaviors and make informed predictions about future price movements. Bar charts help identify significant support and resistance levels. These levels are indicated by horizontal lines formed by the opening and closing prices. Traders can use these levels to determine entry and exit points, set stop-loss orders, and gauge the strength of market trends. Bar charts can be combined with volume information to analyze the strength or weakness behind price movements. By comparing the height of bars with the corresponding volume, traders can identify periods of high trading activity and assess the significance of price changes. Bar charts can be used in conjunction with various technical indicators and oscillators. Traders often overlay moving averages, trendlines, or oscillators on bar charts to generate additional signals and confirm or validate their trading decisions. Bar charts are widely available on trading platforms, charting software, and financial websites. They are a standard feature in technical analysis tools, making them easily accessible to traders and investors. Bar charts can appear complex, especially for beginners new to technical analysis. The multiple lines and intersections may be overwhelming initially, requiring some time and practice to fully understand and interpret the information presented. Although bar charts provide valuable information on price levels, volatility, and direction, they do not offer insights into other factors that can influence the market, such as fundamental analysis or market sentiment. Traders may need to supplement bar charts with additional tools and indicators to gain a more comprehensive understanding of the market. The interpretation of bar charts can be subjective, as different traders may analyze the same chart and reach different conclusions. Traders may have varying opinions on the significance of certain patterns or levels, leading to conflicting trading decisions. Bar charts are based on historical price data, which means they primarily reflect past market behavior. While historical patterns and trends can provide insights into potential future movements, they do not guarantee future outcomes. Market conditions can change, and relying solely on historical patterns may lead to inaccurate predictions. Bar charts display price information for a specific timeframe, such as daily, hourly, or minute intervals. Different timeframes can provide different perspectives on market behavior. Traders need to carefully select the appropriate timeframe based on their trading strategy and objectives, as using the wrong timeframe may lead to misleading or conflicting signals. Bar charts are typically updated at the end of each trading period, whether it's a day, hour, or minute. This means that traders relying solely on bar charts may not have real-time information on price movements. For intraday trading or when quick decision-making is required, real-time data from other sources may be necessary. Candlestick patterns are a popular tool in technical analysis, offering visual insights into market psychology. They differ slightly from bar charts, with a 'body' that represents the range between the opening and closing prices, and 'wicks' or 'shadows' representing the high and low prices. Candlestick patterns can show reversal signals or continuation signals depending on the pattern formed. By combining bar chart patterns with candlestick patterns, traders can validate potential trading signals. For instance, an uptrend identified in the bar chart could be reinforced by a bullish candlestick pattern, such as a Hammer or Bullish Engulfing pattern. Similarly, the appearance of a Bearish Engulfing pattern or Doji during a downtrend could signal a potential trend reversal. This combination of tools allows traders to make more confident and accurate decisions. Another way to boost the effectiveness of bar charts is by integrating them with technical indicators and oscillators. These tools serve as a mathematical calculation that can be applied to a security's price, volume, or even another technical indicator. They help assess various aspects of the market, such as its direction, strength, momentum, and volatility. The Moving Average (MA) is a trend-following indicator that smoothens past price data to identify the direction of a trend. When the price is above the MA, it indicates a potential uptrend, and vice versa. MAs of different lengths can be plotted on the bar chart to identify potential support and resistance levels and crossover points, providing buy or sell signals. RSI is a momentum oscillator that measures the speed and change of price movements. It oscillates between 0 and 100, with levels above 70 indicating overbought conditions and levels below 30 indicating oversold conditions. Traders can use RSI in conjunction with bar chart patterns to identify potential reversal points. For instance, a bullish divergence between the RSI and price (where the RSI makes higher lows while the price makes lower lows) could suggest a potential upward reversal. MACD is a trend-following momentum indicator that shows the relationship between two moving averages of a security’s price. Traders use MACD to identify potential buy and sell signals. When the MACD crosses above its signal line, a bullish signal is generated, and vice versa. Bar charts are valuable tools in technical analysis that provide a clear and concise visual representation of price action over a specific period. By analyzing the patterns and trends in bar charts, traders can identify key levels, predict future price movements, and make informed trading decisions. The advantages of using bar charts include their clear representation of price action, historical comparison capabilities, identification of key levels, volume analysis integration, and compatibility with other indicators. However, bar charts also have limitations, such as their complexity for beginners, limited information on other market factors, subjective interpretation, historical bias, timeframe limitations, and lack of real-time updates. To enhance the effectiveness of bar charts, traders can integrate them with candlestick patterns, technical indicators, and oscillators to validate signals and gain deeper insights into market trends and momentum. It is important to remember that interpreting bar charts and making trading decisions can be complex and subjective. Therefore, it is highly recommended to seek professional guidance from experienced traders, financial advisors, or mentors who can provide expertise and help navigate the intricacies of technical analysis. They can assist you in understanding the nuances of bar chart patterns, integrating them with other tools, and developing a solid trading strategy tailored to your goals and risk tolerance.What Is a Bar Chart?
Bar Chart Interpretation
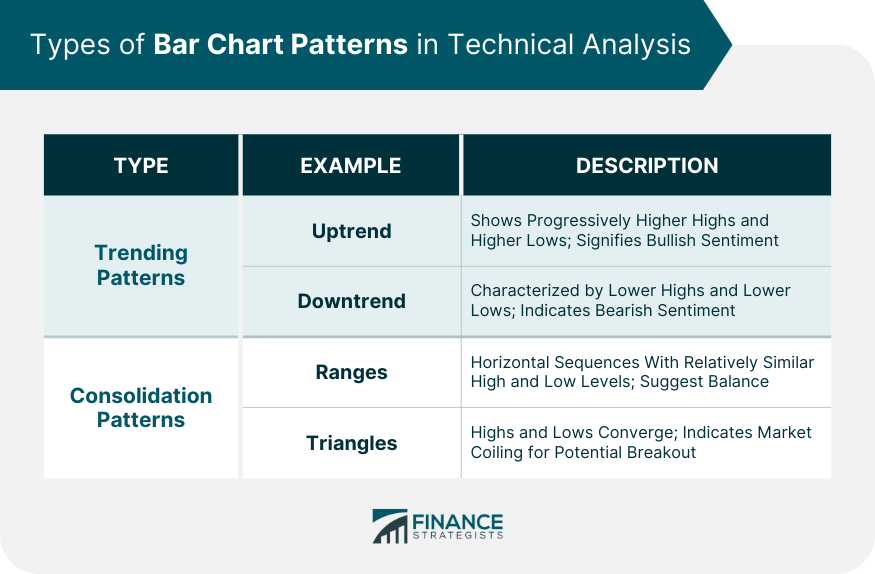
Types of Bar Chart Patterns in Technical Analysis
Trending Patterns
1. Uptrends: An uptrend is characterized by a series of bars with progressively higher highs and higher lows. This pattern signifies bullish sentiment in the market.
2. Downtrends: Conversely, a downtrend comprises bars with lower highs and lower lows, indicating bearish market sentiment.
Consolidation Patterns
1. Ranges: Range patterns are identified by horizontal sequences of bars where the highs and lows are relatively at the same levels. This pattern suggests a balance between buying and selling pressures.
2. Triangles: Triangles are formed when the highs and lows of bars converge towards each other. This pattern indicates that the market is coiling for a potential breakout in either direction.
Application of Bar Chart Patterns in Trading
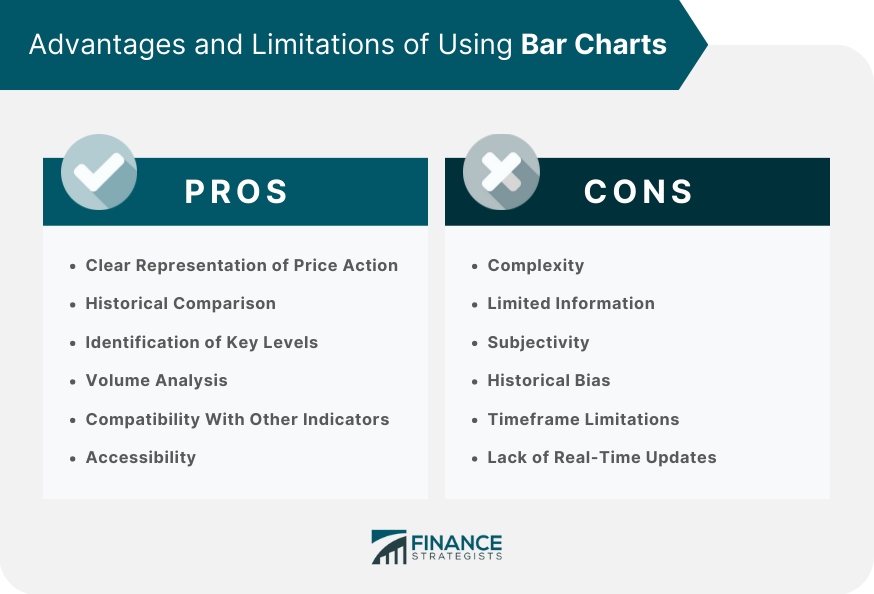
Advantages of Using Bar Charts
Clear Representation of Price Action
Historical Comparison
Identification of Key Levels
Volume Analysis
Compatibility With Other Indicators
Accessibility
Limitations of Using Bar Charts
Complexity
Limited Information
Subjectivity
Historical Bias
Timeframe Limitations
Lack of Real-Time Updates
Integrating Bar Charts With Other Technical Analysis Tools
Candlestick Patterns
Indicators and Oscillators
Moving Averages
Relative Strength Index (RSI)
Moving Average Convergence Divergence (MACD)
Final Thoughts
Bar Chart FAQs
Reading a bar chart involves understanding the four main data points: opening price, closing price, high price, and low price. Each bar represents a specific period, with the vertical line indicating the high and low prices, and the horizontal lines representing the opening and closing prices.
A long bar on a bar chart suggests significant price movement within the given period, indicating high volatility. Conversely, a short bar indicates less variability and lower price movement.
By analyzing the sequence of bars and patterns formed, such as rising or falling highs and lows, traders can gain insights into potential trends and anticipate future price movements. These patterns can assist in making informed predictions about the market's direction.
Bar charts offer a clear representation of price action, allow for historical comparisons, help identify key levels of support and resistance, enable volume analysis, and can be combined with other technical indicators for enhanced analysis and decision-making.
Bar charts can be used for intraday trading, but it's important to note that they are typically updated at the end of each trading period. For real-time information, traders may need to rely on additional sources or platforms that provide up-to-date data for intraday decision-making.
True Tamplin is a published author, public speaker, CEO of UpDigital, and founder of Finance Strategists.
True is a Certified Educator in Personal Finance (CEPF®), author of The Handy Financial Ratios Guide, a member of the Society for Advancing Business Editing and Writing, contributes to his financial education site, Finance Strategists, and has spoken to various financial communities such as the CFA Institute, as well as university students like his Alma mater, Biola University, where he received a bachelor of science in business and data analytics.
To learn more about True, visit his personal website or view his author profiles on Amazon, Nasdaq and Forbes.


