
The Calmar Ratio is a risk-adjusted performance measure that is commonly used in the finance industry to evaluate investment strategies. It was developed by Terry W. Young, who named it after the California Managed Accounts Reports (CALMAR) that were published in the 1990s. The Calmar Ratio is calculated by dividing the annualized rate of return of an investment strategy by its maximum drawdown. The maximum drawdown is the largest percentage decline from the investment strategy's peak value to its subsequent low point. In other words, it represents the worst possible loss that an investor could have experienced if they had invested in the strategy at the wrong time. The Calmar Ratio is useful because it measures an investment's return in relation to its risk. A high Calmar Ratio indicates that the investment strategy has generated strong returns relative to the risk that investors have taken. Conversely, a low Calmar Ratio indicates that the investment strategy has not performed well compared to its risk level. Investors and fund managers often use the Calmar Ratio to compare the risk-adjusted performance of different investment strategies. It can be particularly useful when evaluating alternative investment strategies such as hedge funds, private equity funds, and managed futures funds, where risk is an important consideration. The Calmar Ratio consists of two primary components: the annualized rate of return and the maximum drawdown. The annualized rate of return is the geometric average of an investment's returns over a specified period, adjusted to reflect a one-year time frame. This measure allows investors to compare the performance of investments with different time horizons on a level playing field. To calculate the annualized rate of return, first, compute the cumulative return by dividing the final value of the investment by its initial value. Next, raise this result to the power of 1/n, where n is the number of years the investment was held, and subtract 1. Multiply the result by 100 to obtain the annualized rate of return as a percentage. The maximum drawdown is the largest percentage decline in an investment's value over a specified time frame, reflecting the worst possible loss an investor could have experienced by investing in that asset. It is a useful measure of the risk involved in an investment strategy. To calculate the maximum drawdown, first, identify the highest and lowest points in the investment's value over the specified time frame. Then, compute the percentage decline by dividing the difference between the highest and lowest points by the highest point. Multiply the result by 100 to obtain the maximum drawdown as a percentage. Calculate the annualized rate of return of the investment. Calculate the maximum drawdown of the investment. Divide the annualized rate of return by the maximum drawdown to obtain the Calmar Ratio. Assume an investment has an annualized rate of return of 15% and a maximum drawdown of 20%. The Calmar Ratio would be 15%/20% = 0.75. A higher Calmar Ratio indicates better risk-adjusted performance, as it implies that the investment generates a higher return per unit of risk taken. Conversely, a lower Calmar Ratio suggests poorer risk-adjusted performance. The Sharpe Ratio measures the excess return per unit of risk, as represented by the investment's standard deviation. While the Calmar Ratio focuses on the worst-case scenario through the maximum drawdown, the Sharpe Ratio considers overall volatility. The Sortino Ratio is similar to the Sharpe Ratio but only considers downside risk or negative volatility. It is more suitable for investors who are primarily concerned about losses. The Treynor Ratio measures the excess return per unit of systematic risk, as represented by the investment's beta. It is most appropriate for diversified portfolios where unsystematic risk has been minimized. The Omega Ratio measures the ratio of the probability-weighted gains to the probability-weighted losses relative to a specified return threshold. It provides a more comprehensive view of the risk-return trade-off. Each risk-adjusted performance measure has its strengths and weaknesses. The Calmar Ratio focuses on the worst-case scenario, making it suitable for assessing strategies with significant tail risks. The Sharpe and Sortino Ratios are more versatile, as they can be applied to a broader range of investments, but they may not capture the risk of extreme events as effectively as the Calmar Ratio. The Treynor Ratio is useful for analyzing diversified portfolios but may not be as relevant for individual assets. The Omega Ratio offers a comprehensive view of risk-return trade-offs but may be more challenging to calculate and interpret. The Calmar Ratio helps portfolio managers assess the risk-adjusted performance of various investment strategies and make informed decisions about which assets to include in their portfolios. By comparing the Calmar Ratios of different investments, managers can balance risk and return more effectively. The Calmar Ratio is particularly relevant in the context of hedge funds and managed futures, which often employ high-risk strategies with significant drawdowns. Investors and fund managers can use the Calmar Ratio to evaluate the performance of these strategies relative to the risks involved. The Calmar Ratio can be a valuable tool in determining the optimal allocation of assets within a portfolio. By comparing the risk-adjusted performance of various asset classes, investors can allocate their capital more efficiently, maximizing returns while minimizing risk. The Calmar Ratio can be used to compare the performance of individual investments, funds, or portfolios against relevant benchmarks. This can help investors and fund managers gauge the effectiveness of their investment strategies and make adjustments as needed. The Calmar Ratio can be sensitive to the time period chosen for analysis, which may lead to inconsistent results. Different time frames may yield different maximum drawdowns, affecting the overall Calmar Ratio. Investors should be cautious when comparing Calmar Ratios based on different time periods. The Calmar Ratio is heavily influenced by the maximum drawdown, which can be significantly affected by extreme events or outliers. This may lead to an overemphasis on a single event, potentially distorting the overall risk-adjusted performance evaluation. Comparing the Calmar Ratio across different asset classes can be challenging due to differences in the risk-return profiles and the nature of drawdowns. It is essential to consider the context and specific characteristics of each asset class when using the Calmar Ratio for comparisons. The maximum drawdown may not fully capture the risk of an investment, as it only considers the largest decline in value. Smaller, more frequent drawdowns, which can also be detrimental to an investment's performance, may not be adequately represented in the Calmar Ratio. To obtain a comprehensive view of an investment's risk-adjusted performance, it is essential to use multiple performance measures. The Calmar Ratio should be used in conjunction with other risk-adjusted performance measures, such as the Sharpe Ratio, Sortino Ratio, Treynor Ratio, and Omega Ratio. The Calmar Ratio may be more relevant for investments with a longer time horizon, as short-term fluctuations in value can distort the maximum drawdown component. Investors should consider their investment time horizon when using the Calmar Ratio for performance evaluation. The Calmar Ratio should be interpreted in the context of the specific asset class, investment strategy, and market conditions. Comparing Calmar Ratios across different contexts may lead to misleading conclusions. Investors should regularly monitor and update their Calmar Ratio calculations to ensure that they are making informed decisions based on the most recent data. This is particularly important in times of market volatility or when significant changes occur within an investment strategy or portfolio. The Calmar Ratio is a valuable tool for assessing risk-adjusted performance in the investment world. By focusing on the worst-case scenario through the maximum drawdown, it helps investors and portfolio managers evaluate the performance of high-risk strategies and make more informed decisions about asset allocation and portfolio management. However, the Calmar Ratio should not be used in isolation. It is essential to consider other risk-adjusted performance measures, the investment time horizon, and the specific context of each asset class or investment strategy. By using the Calmar Ratio in conjunction with other performance metrics, investors can gain a comprehensive understanding of their investments' risk-return profiles and make more informed decisions about their portfolios.What Is the Calmar Ratio?
Components of the Calmar Ratio
Annualized Rate of Return
Definition
Calculation
Maximum Drawdown
Definition
Calculation
Calculating the Calmar Ratio
Step-By-step Process
Example Calculation
Interpretation of the Results
Comparing the Calmar Ratio With Other Risk-Adjusted Performance Measures
Sharpe Ratio
Sortino Ratio
Treynor Ratio
Omega Ratio
Strengths and Weaknesses of Each Measure
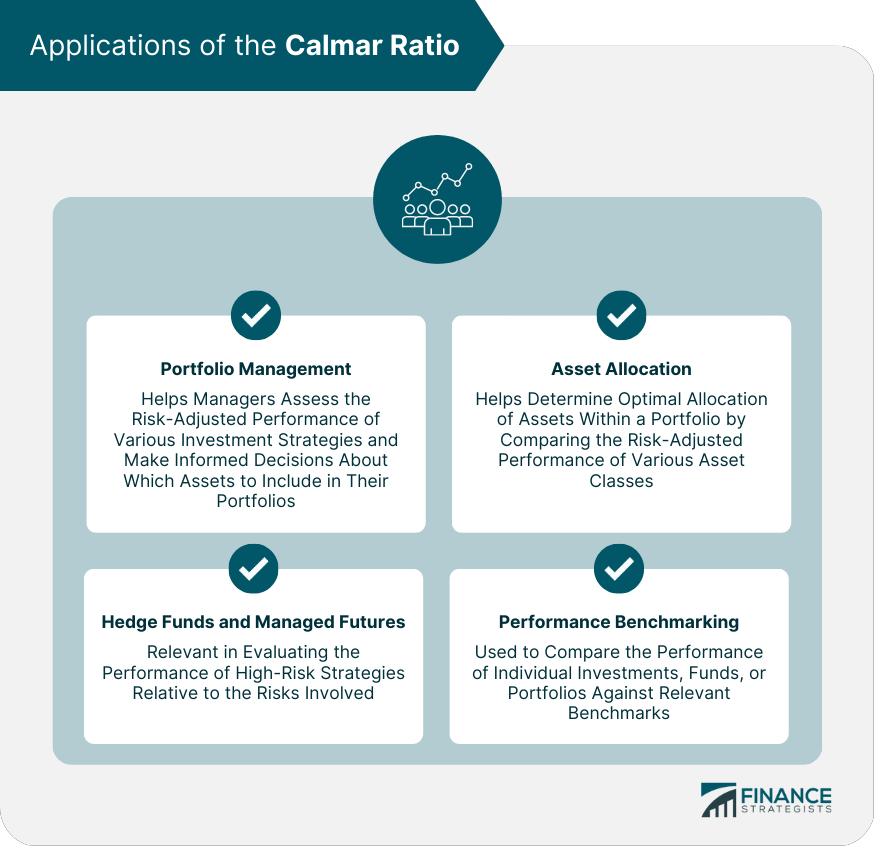
Applications of the Calmar Ratio
Portfolio Management
Hedge Funds and Managed Futures
Asset Allocation
Performance Benchmarking
Limitations and Criticisms of the Calmar Ratio
Dependence on the Time Period
Sensitivity to Outlier Events
Difficulty in Comparing Across Asset Classes
Issues With the Maximum Drawdown Component
Tips for Using the Calmar Ratio Effectively
Using Multiple Performance Measures
Considering the Investment Time Horizon
Keeping Context in Mind
Regularly Monitoring and Updating
Conclusion
Calmar Ratio FAQs
The Calmar ratio is a risk-adjusted performance measure that evaluates the return of an investment relative to its maximum drawdown.
The Calmar ratio is calculated by dividing the average annual return of an investment by its maximum drawdown.
A good Calmar ratio is subjective and depends on the investor's risk tolerance and investment goals. However, generally, a ratio above 1 is considered good, while a ratio below 0.5 is considered poor.
The Calmar ratio can be used to compare the risk-adjusted performance of different investment strategies or funds. It can also help investors assess the risk-return tradeoff of an investment.
The Calmar ratio has some limitations. For instance, it assumes that the maximum drawdown is a good measure of risk, which may not always be the case. Additionally, it only considers historical data and does not account for future market conditions or events.
True Tamplin is a published author, public speaker, CEO of UpDigital, and founder of Finance Strategists.
True is a Certified Educator in Personal Finance (CEPF®), author of The Handy Financial Ratios Guide, a member of the Society for Advancing Business Editing and Writing, contributes to his financial education site, Finance Strategists, and has spoken to various financial communities such as the CFA Institute, as well as university students like his Alma mater, Biola University, where he received a bachelor of science in business and data analytics.
To learn more about True, visit his personal website or view his author profiles on Amazon, Nasdaq and Forbes.


