
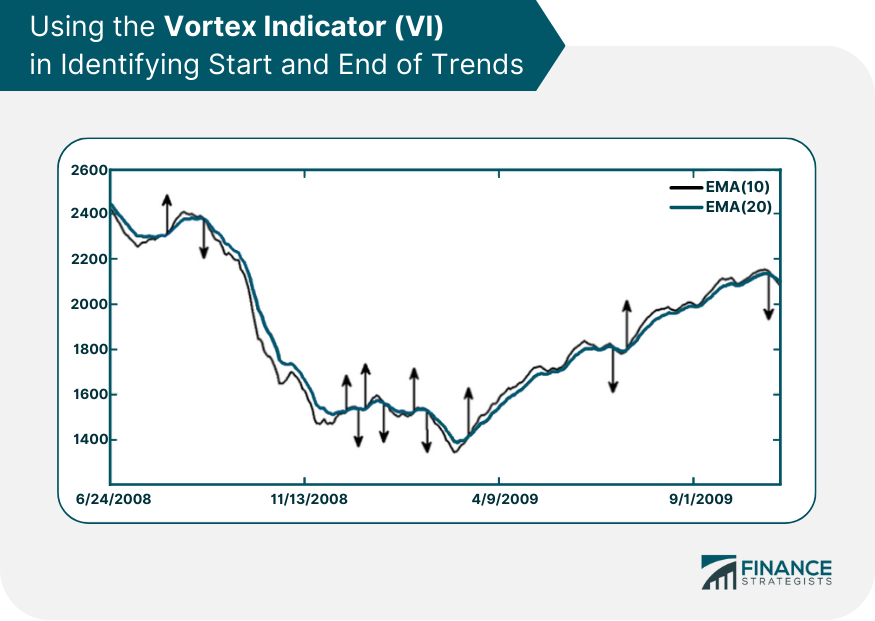
The Vortex Indicator (VI) is an algorithmic tool used to detect trend reversals in securities pricing. Developed by Etienne Botes and Douglas Siepman in 2009, it bases the formation and direction of current trends on previous periods' highs, lows, and closing prices. The VI's results are represented as an oscillator, with intersecting lines indicating bullish or bearish market trends. The indicator's concept, inspired by the natural vortex behaviors observed in water flow and predator-prey relationships, parallels dynamic market actions and trend reversals. In trading, the VI aids in pinpointing the onset and conclusion of market trends, providing key insights for technical analysts and traders. It offers an understanding of market volatility and the strength of price movements, and assists in determining trade entry and exit points, thus potentially improving decision-making efficiency and profitability. The process of computing the Vortex Indicator is partitioned into four stages. Maximum of the current day's high less the day's low. Maximum of the current day's high less the previous day's closing. The current day's low less than the previous day's closing. VM+ is the absolute difference between the current high and the previous low. VM- is the absolute difference between the current low and the previous high. Choose a parameter length (typically between 14 and 30 days) Calculate the cumulative total of the last n period's true range, VM+, and VM-: Total of the last n period's true range = SUM TRn Total of the last n period's VM+ = SUM VMn+ Total of the last n period's VM- = SUM VMn− SUM VMn+/SUM TRn = VIn+ SUM VMn-/SUM TRn = VIn− This calculation is repeated daily to establish the VI+ and VI- trendlines. The conventional method of using VI- and VI+ intersections can generate multiple erroneous trading signals when the price fluctuates significantly. To minimize this, increase the number of periods used in the indicator, for example, by using 25 periods instead of 14. The Positive Vortex Indicator (VI+) and the Negative Vortex Indicator (VI-) are essential tools used to indicate price movements in trading. In essence, the VI+ is indicative of an upward price movement, thus signaling the potential for profit. On the other hand, the VI- represents a downward price movement, which suggests a fall in the value of the asset or stock. A crucial aspect of using these indicators is understanding the implications of the crossovers between the VI+ and the VI-. When the VI+ line crosses above the VI- line, this generally signifies a bullish trend, indicating an upward price trend that could present a good opportunity for buying. However, the crossing of the VI- line above the VI+ line signals a bearish trend, a downward price trend, which could potentially be an ideal time to sell. The calculation of the Vortex Indicator heavily leans on the concept of the True Range. This is a metric that measures the price range during a specific period while also taking into account the previous close. By providing an understanding of the price volatility, the True Range can help traders anticipate potential price movements. Alongside the True Range, the Vortex Movement is another essential component of the VI calculation. It denotes the distance between the low and high prices of the current and previous period. This particular distance is then used to calculate both the Positive and Negative Vortex Movements, each contributing significantly to the overall calculation of the Vortex Indicator. The results of the VI calculation play a vital role in strategic trading decisions. A crucial part of this is understanding the implications of the VI+ and VI- crossovers. As previously stated, when the VI+ line crosses above the VI- line, it suggests a bullish trend, while a crossing of the VI- line above the VI+ line implies a bearish trend. These crossovers are typically used by traders as buy and sell signals. A bullish crossover (VI+ above VI-) may be seen as a signal to buy, whereas a bearish crossover (VI- above VI+) might be interpreted as a cue to sell. In addition to identifying trends, the Vortex Indicator can also provide clues about potential trend reversals. This can happen when there is a divergence between the Vortex Indicator and the price. Such divergences often precede trend reversals, and recognizing these can help traders to better position their trading strategies. When VI+ crosses above VI-, it is a signal of a potential beginning of an upward trend. Similarly, when VI- crosses above VI+, it may suggest the start of a downward trend. Traders use this crossover information to anticipate the emergence of new trends and adjust their trading strategies accordingly. A crossover in the opposite direction may indicate the end of a trend. For instance, if VI+ crosses above VI- during a downward trend, it could signal the end of the bearish trend and the start of a bullish one. Likewise, if VI- crosses above VI+ during an upward trend, it could signal the end of the bullish trend and the start of a bearish one. The figure below shows the historical data of the NASDAQ Composite Index between June 2008 and November 2009 is displayed in the form of curves. The black curve represents a 10-day exponential moving average, while the blue curve represents a 20-day exponential moving average. Buy signals are indicated by upward arrows, while sell signals are represented by downward arrows. These moving averages were calculated using MATLAB. The Vortex Indicator also provides information about market volatility. The wider the gap between the VI+ and VI- lines, the higher the market volatility, as it shows greater price movement. Traders use this information to anticipate changes in price and make informed decisions. While both the Vortex Indicator and Relative Strength Index (RSI) are momentum oscillators, their use varies significantly. The VI identifies the start and end of trends and provides insight into market volatility. In contrast, the RSI measures the speed and change of price movements, and it is typically used to identify overbought or oversold conditions. The Vortex Indicator and Moving Average Convergence Divergence (MACD) both offer trend-following momentum indicators, but they operate differently. While the VI focuses on the relationship between high and low prices, the MACD focuses on the relationship between two moving averages of a security's price. MACD is typically used to identify buy and sell signals, while the VI is used for spotting trend reversals and understanding volatility. Bollinger Bands and the Vortex Indicator also offer different insights. While the VI tracks the start and end of trends, Bollinger Bands measure a security's volatility. Bollinger Bands consist of a middle band with two outer bands and can help identify whether a security's price is high or low. The VI, on the other hand, provides signals of bullish or bearish trends. One of the significant strengths of the Vortex Indicator is its efficiency in identifying new trends. It calculates the positive and negative vortex movements over a period to provide an early indication of a potential trend reversal. Whether a market is shifting from a bullish to a bearish trend, or vice versa, the Vortex Indicator gives a clear crossover signal, making it a crucial tool for traders looking to capitalize on new trends. Another advantage of the Vortex Indicator is its ability to provide clear buy and sell signals. When the VI+ line crosses above the VI- line, it could be interpreted as a buying opportunity, indicating an upcoming bullish trend. Conversely, when the VI- crosses above the VI+, it may be a signal to sell, hinting at an incoming bearish trend. This clarity of signals is advantageous for both novice and seasoned traders as it simplifies the decision-making process. The Vortex Indicator is also versatile and can be effective across various market conditions. Whether in a volatile market with significant price changes or a more stable market with minimal price movement, the VI can provide valuable insights to help traders navigate the market and make informed trading decisions. Despite its many strengths, the Vortex Indicator, like any technical indicator, is not without its limitations. One such limitation is the risk of generating false signals, particularly in range-bound or sideways markets. Since the VI calculates positive and negative vortex movements based on the high and low price points, it may not accurately predict trend direction in a market where prices are largely unchanged. This could potentially lead traders to make ill-advised trading decisions. Another limitation of the Vortex Indicator is that while it can help identify the start and end of trends, it does not provide information about the duration or strength of these trends. This lack of predictive power regarding how long a trend might last or how strong it might be can leave traders unsure of when to exit a trade or how much to invest. As a result, traders may need to supplement their use of the Vortex Indicator with other technical indicators or analysis methods that can provide this information. The most basic strategy using the Vortex Indicator involves trading on crossovers. When the VI+ line crosses above the VI- line, a trader might take this as a signal to buy. When the VI- line crosses above the VI+ line, it could be a sign to sell. This strategy can be effective, particularly in markets with strong trends. For more advanced trading strategies, the Vortex Indicator can be used in combination with other technical indicators. For instance, a trader might use the Relative Strength Index (RSI) or the Moving Average Convergence Divergence (MACD) to confirm signals provided by the VI. Alternatively, Bollinger Bands could be used in conjunction with the VI to provide additional insight into volatility and potential price reversals. In MetaTrader, traders can add the Vortex Indicator to their chart by clicking on "Insert," then "Indicators," then "Custom," and finally selecting "Vortex Indicator." The VI will then be applied to the price chart, providing the trader with the VI+ and VI- lines to aid in their analysis. On TradingView, the VI can be added by clicking on the "Indicators" button at the top of the screen and then typing "Vortex Indicator" into the search box. After selecting it, the VI lines will appear on the price chart. On most other trading platforms, adding the Vortex Indicator involves a similar process. Traders usually need to navigate to the indicators menu and search for the VI. However, the exact steps can vary, so traders should consult their platform's help or user guide for precise instructions. The Vortex Indicator (VI) is a crucial technical analysis tool that provides insights into the trend direction of a market. It is calculated based on the high, low, and close prices over a specific period. The VI's significance lies in its ability to identify the beginning and end of trends, providing clear buy and sell signals to traders. Traders can develop strategies based on these signals, taking advantage of the VI's strengths while being mindful of its limitations, such as the risk of false signals and lack of information about trend duration and strength. Despite these limitations, the Vortex Indicator remains a powerful tool for understanding market trends. If you're looking to take your trading to the next level, consider seeking professional wealth management services to help you leverage tools like the VI effectively.What Is Vortex Indicator (VI)?
Concept and Calculation of the VI
Formula of the VI
Determining the True Range (TR)
Identifying the Upward And Downward Motion:
Setting a Parameter Length (n)
Drawing the Trendlines Vi+ And Vi-
Understanding the Positive and Negative Vortex Indicators (VI+ and VI-)
Role of VI+ and VI- in Identifying Price Movements
Significance of VI+ and VI- Crossovers
Calculative Components of the VI
Understanding True Range and Its Role in VI Calculation
Defining Vortex Movement and Its Influence on VI
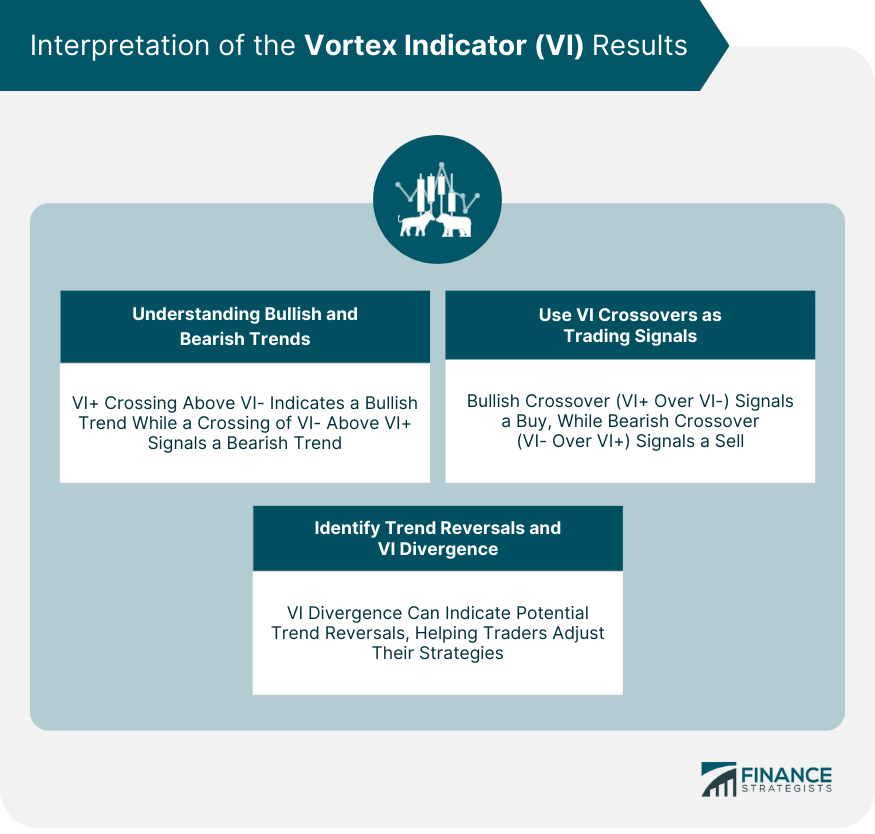
Interpretation of the VI Results
Deciphering Bullish and Bearish Trends
Using VI Crossovers as Trading Signals
Potential Trend Reversals and VI Divergence
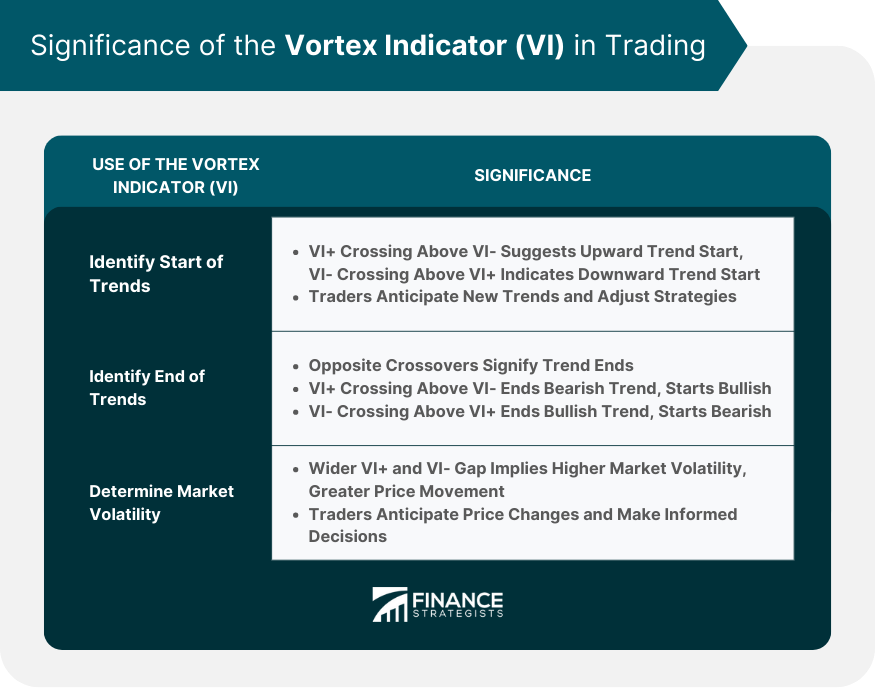
Significance of the VI in Trading
Use of the VI in Identifying Start of Trends
Use of the VI in Identifying End of Trends
Using the VI to Determine Market Volatility
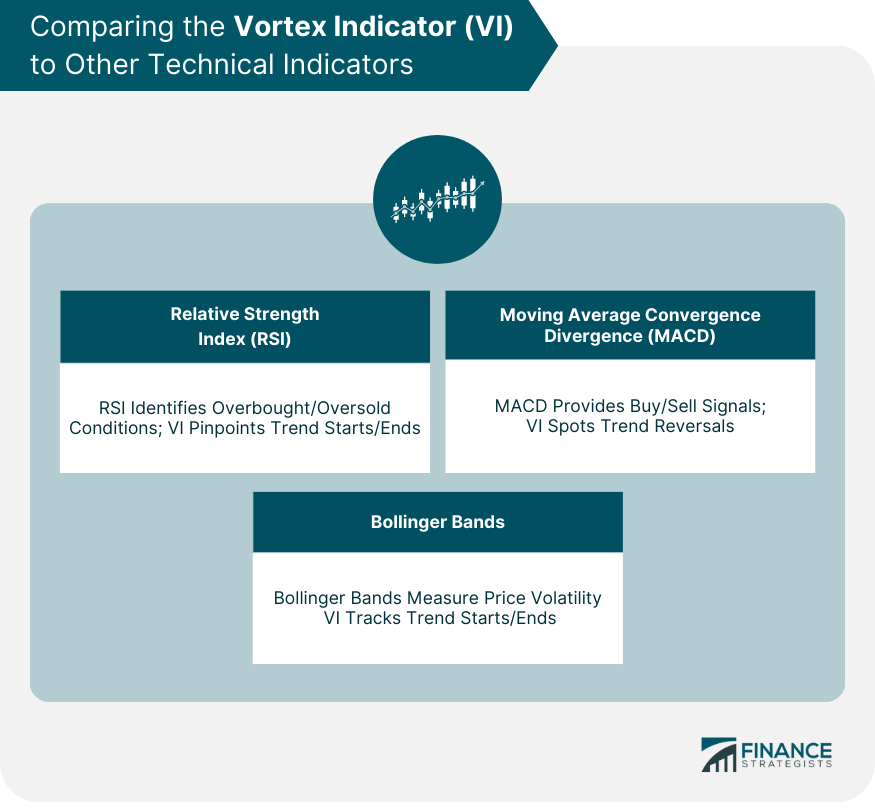
Comparing the VI to Other Technical Indicators
Comparison of VI With Relative Strength Index (RSI)
Comparison of VI With Moving Average Convergence Divergence (MACD)
Comparison of VI With Bollinger Bands
Strengths of the VI
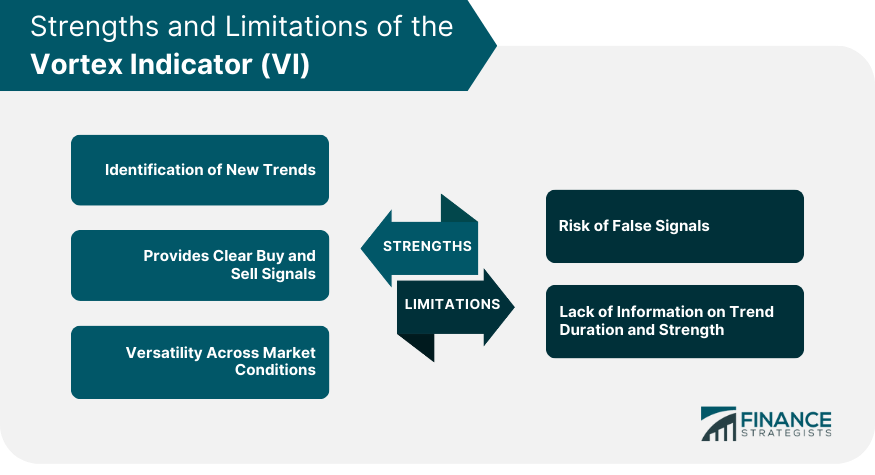
Identification of New Trends
Clear Buy and Sell Signals
Versatility Across Market Conditions
Limitations of the VI
Risk of False Signals
Lack of Information on Trend Duration and Strength
Strategies for Using the VI in Trading
Basic VI Trading Strategy
Advanced Strategies Using the VI Along With Other Technical Indicators
How to Implement the VI on Trading Platforms
Using the VI on MetaTrader
Using the VI on TradingView
Using the VI on Other Platforms
Final Thoughts
Vortex Indicator (VI) FAQs
The Vortex Indicator (VI) is a technical analysis tool that uses the relationship between high and low prices to identify the start and end of market trends.
The Vortex Indicator (VI) is calculated using a specific formula that involves the positive and negative vortex movements and the true range over a given period.
The Vortex Indicator (VI) provides clear buy and sell signals based on crossovers. A bullish trend is indicated when the VI+ line crosses above the VI- line, and a bearish trend is suggested when the VI- line crosses above the VI+ line.
The limitations of the Vortex Indicator (VI) include the potential for false signals in range-bound or sideways markets and a lack of information about the duration or strength of trends.
The Vortex Indicator (VI) can be used in conjunction with other technical indicators like the Relative Strength Index (RSI) or the Moving Average Convergence Divergence (MACD) to confirm signals and provide a more comprehensive picture of market conditions.
True Tamplin is a published author, public speaker, CEO of UpDigital, and founder of Finance Strategists.
True is a Certified Educator in Personal Finance (CEPF®), author of The Handy Financial Ratios Guide, a member of the Society for Advancing Business Editing and Writing, contributes to his financial education site, Finance Strategists, and has spoken to various financial communities such as the CFA Institute, as well as university students like his Alma mater, Biola University, where he received a bachelor of science in business and data analytics.
To learn more about True, visit his personal website or view his author profiles on Amazon, Nasdaq and Forbes.


