
Stochastic RSI, or StochRSI, is a technical analysis indicator that applies the stochastic oscillator formula to the Relative Strength Index (RSI). The StochRSI aims to provide an improved version of the RSI, one that is more sensitive and can provide faster signals. Like the stochastic oscillator and the RSI, the StochRSI is a momentum indicator that ranges between 0 and 1 (or 0 and 100, depending on the charting platform). Stochastic RSI serves a critical role in wealth management. It can assist investors and traders in identifying potential buy and sell signals. Its heightened sensitivity compared to the standard RSI can often mean that it provides these signals earlier. Through its identification of overbought and oversold conditions, as well as bullish and bearish divergences, StochRSI can be a powerful tool for wealth management professionals seeking to maximize returns and minimize risks. The Stochastic RSI is calculated by applying the formula for the stochastic oscillator to the values of the RSI. The calculation begins with determining the RSI over a given period, often 14 periods. Then, the lowest and highest RSI values over a given period are identified, and the current RSI value is compared to this range. The formula for the StochRSI is as follows: StochRSI = (RSI - Lowest Low RSI) / (Highest High RSI - Lowest Low RSI). The result of this calculation is the StochRSI value. The StochRSI values are interpreted in a similar manner to the stochastic oscillator. When the StochRSI is at or near 1 (or 100), it indicates that the asset's price is at or near the high end of its recent range, and the asset might be overbought. Conversely, when the StochRSI is at or near 0, it indicates that the asset's price is at or near the low end of its recent range, and the asset might be oversold. Like the stochastic oscillator, the StochRSI uses overbought and oversold thresholds to generate potential trading signals. Commonly used thresholds are 0.8 for the overbought level and 0.2 for the oversold level. However, these values can be adjusted based on an individual trader's risk tolerance and trading style. StochRSI, similar to other momentum indicators, provides insights into the strength of the current market trend. Rising StochRSI values typically correspond with strong upward trends, while declining StochRSI values suggest strong downward trends. Moreover, a reading in the middle of the range (around 0.5 or 50) often indicates a lack of trend or a market in consolidation. Divergence analysis is a critical part of interpreting the StochRSI. Bullish divergence occurs when the price makes a new low, but the StochRSI makes a higher low. This divergence can be an early signal that the downward trend is losing strength and may reverse soon. Conversely, bearish divergence occurs when the price makes a new high, but the StochRSI makes a lower high. This divergence can be an early signal that the upward trend is losing momentum and may soon reverse. StochRSI can also be used to identify bullish and bearish crossovers. A bullish crossover occurs when the StochRSI crosses above a certain level or another indicator, signaling potential buying opportunities. A bearish crossover occurs when the StochRSI crosses below a certain level or another indicator, signaling potential selling opportunities. Signal line confirmation refers to using a moving average or another indicator as a confirmation of the signals given by the StochRSI. The most straightforward strategy using the StochRSI involves trading based on overbought and oversold signals. When the StochRSI rises above the overbought threshold, a sell signal is generated, as this might indicate that the asset is overpriced relative to its recent range. Conversely, when the StochRSI falls below the oversold threshold, a buy signal is generated, as this might indicate that the asset is underpriced relative to its recent range. Trend reversal confirmation involves using the StochRSI to confirm potential trend reversals signaled by other aspects of technical analysis. For instance, a bullish divergence between the price and the StochRSI might be used to confirm a potential bullish reversal signaled by a candlestick pattern or a trendline break. Divergence-based trading involves initiating trades based on bullish or bearish divergences between the price and the StochRSI. This strategy can be particularly effective in volatile markets where price reversals can occur frequently. Like other technical indicators, the StochRSI can generate false signals. A false signal refers to a situation where the StochRSI signals a potential trading opportunity, but the expected price movement does not occur. Traders should be wary of relying solely on the StochRSI and should use it in conjunction with other technical indicators and analysis techniques. Additionally, in markets with high volatility, the StochRSI can lead to whipsaws. A whipsaw is a situation where the price quickly reverses direction after a trader has initiated a trade based on a signal from the StochRSI, leading to a potential loss. While the StochRSI can be a valuable tool in analyzing market momentum, it can be less reliable in volatile or choppy market conditions. In such conditions, the StochRSI might oscillate rapidly between overbought and oversold levels, making it challenging to identify clear trading signals. The StochRSI should ideally not be used in isolation but rather in conjunction with other technical analysis indicators or methods. Other indicators, such as moving averages, trendlines, or volume indicators, can provide valuable confirmation of the signals given by the StochRSI, increasing their reliability. In stock market analysis, the StochRSI can be used to identify potential reversals in the price of individual stocks. For instance, a bullish divergence between the price and the StochRSI might signal a potential buying opportunity in a stock that has been in a downtrend. In forex market analysis, the StochRSI can provide valuable insights into potential reversals in currency pairs. For instance, a bearish divergence between the price and the StochRSI might signal a potential selling opportunity in a currency pair that has been in an uptrend. The StochRSI can also be used in the analysis of cryptocurrency markets. Given the high volatility of cryptocurrencies, the StochRSI can provide faster signals than the standard RSI, which can be particularly valuable. The Stochastic RSI (StochRSI) is a momentum indicator that applies the stochastic oscillator formula to the Relative Strength Index (RSI). The StochRSI provides faster and more sensitive signals than the standard RSI, making it a valuable tool for technical analysis and wealth management. Strategies for incorporating the StochRSI into wealth management include overbought and oversold trading, trend reversal confirmation, and divergence-based trading. The use of these strategies can help wealth management professionals to identify potential trading opportunities and manage risks effectively. The StochRSI is an essential tool in wealth management, providing valuable insights into market momentum and potential price reversals. By accurately interpreting the StochRSI and using it effectively, wealth management professionals can enhance their decision-making process and improve the management of their portfolios.Definition of Stochastic RSI (StochRSI)
Features of Stochastic RSI
Calculation of Stochastic RSI
Interpretation of Stochastic RSI Values
Overbought and Oversold Levels
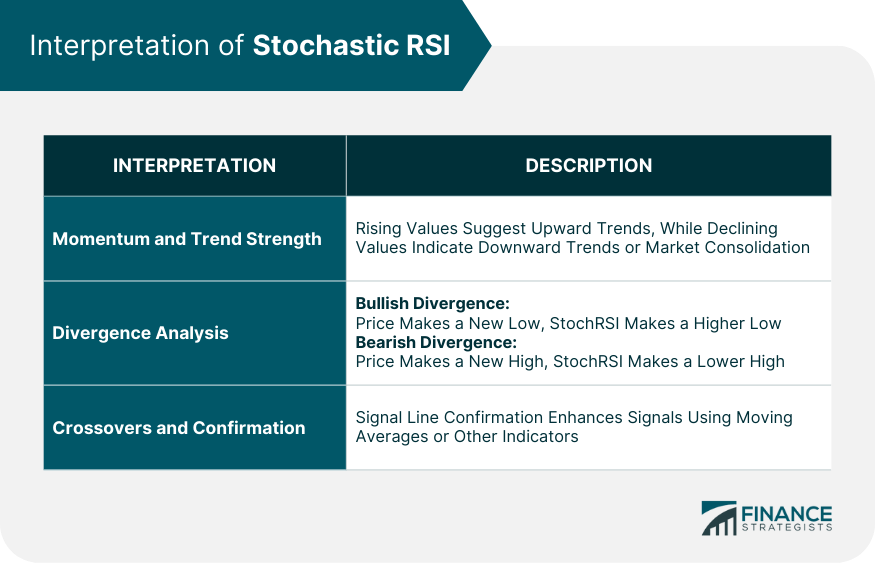
Interpretation of Stochastic RSI
Momentum and Trend Strength
Divergence Analysis
Crossovers and Signal Line Confirmation
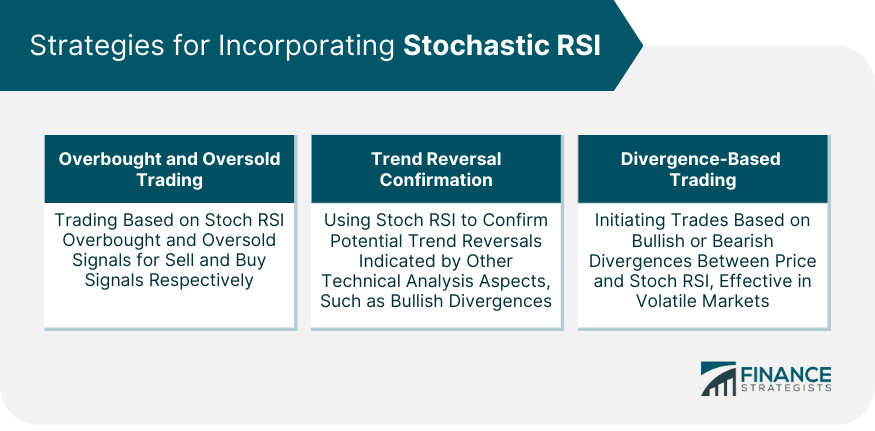
Strategies for Incorporating Stochastic RSI
Overbought and Oversold Trading
Trend Reversal Confirmation
Divergence-Based Trading
Limitations and Considerations in Using Stochastic RSI
False Signals and Whipsaws
Market Volatility and Choppy Conditions
Confirmation With Other Technical Indicators
Examples of Stochastic RSI Analysis
Stock Market Analysis
Forex Market Analysis
Cryptocurrency Market Analysis
Conclusion
Stochastic RSI (StochRSI) FAQs
Stochastic RSI is a technical indicator that combines the features of Stochastic Oscillator and Relative Strength Index (RSI) to analyze market momentum.
Stochastic RSI is calculated by applying the Stochastic formula to the RSI values, resulting in a more sensitive oscillator that helps identify overbought and oversold conditions.
Stochastic RSI can be used to identify potential trend reversals, overbought or oversold levels, and generate trade entry or exit signals in conjunction with other technical analysis tools.
Stochastic RSI combines the benefits of Stochastic Oscillator and RSI, providing a more refined and responsive indicator to capture short-term market conditions and potential reversals.
Like any technical indicator, Stochastic RSI has limitations. It can generate false signals during periods of high volatility, and it's recommended to use it in conjunction with other indicators for confirmation.
True Tamplin is a published author, public speaker, CEO of UpDigital, and founder of Finance Strategists.
True is a Certified Educator in Personal Finance (CEPF®), author of The Handy Financial Ratios Guide, a member of the Society for Advancing Business Editing and Writing, contributes to his financial education site, Finance Strategists, and has spoken to various financial communities such as the CFA Institute, as well as university students like his Alma mater, Biola University, where he received a bachelor of science in business and data analytics.
To learn more about True, visit his personal website or view his author profiles on Amazon, Nasdaq and Forbes.


