
The Simple Moving Average (SMA) is a commonly used technical indicator in financial analysis. It calculates the average price of an asset over a specific period by summing up the closing prices of the asset over that period and dividing it by the number of periods. The SMA is widely used to identify trends, detect support and resistance levels, and provide a smoother representation of price movements. It is known for its simplicity and easy calculation, making it accessible to traders and investors of all experience levels. Market participants can better understand price movements and create effective trading strategies by analyzing the SMA. The Simple Moving Average (SMA) is a widely used technical indicator calculated using a straightforward formula. It involves summing up the asset's closing prices over a specified period and dividing the sum by the total number of days. The primary parameter in SMA calculation is the lookback period, which determines the number of days to include. To calculate the Simple Moving Average (SMA) for an asset, you can follow these steps: Various SMA periods are commonly used in financial analysis, such as: 20-day SMA: This represents the average price over the past month, providing a short-term perspective. 50-day SMA: Offers a medium-term view, covering approximately two months of trading. 200-day SMA: Captures long-term trends by averaging prices over nearly a year. Each SMA type serves a specific purpose, helping traders identify short-, medium-, or long-term trends. The shorter the period, the more sensitive the SMA to price fluctuations. Conversely, a longer period will result in a smoother line, revealing more stable trends. SMA can be used to identify the overall trend direction. If the SMA is rising, it indicates an uptrend; if it is falling, it suggests a downtrend. A flat SMA may signal a sideways or range-bound market. Traders use SMA to identify potential support and resistance levels where prices may reverse or consolidate. These levels can be seen when the price touches or crosses the SMA line multiple times. When prices cross the SMA, it can generate trading signals. For example, a price crossing above the SMA may signal a buying opportunity, while a price crossing below the SMA could indicate a selling opportunity. One of the most notable advantages of the SMA is its simplicity. The formula for calculating SMA is straightforward, even for novice traders and investors. You don't need sophisticated software or technical knowledge to calculate it; basic math skills and access to historical price data are sufficient. SMA is an excellent tool for identifying price trends. By smoothing out daily price fluctuations, the SMA line provides a clearer picture of the prevailing trend over a given period. Whether it's a short-term, intermediate-term, or long-term trend, the SMA can help traders and investors understand the market is direction. Support and resistance levels play a critical role in financial analysis. These are the price levels at which an asset's price stops and reverses. SMA can help identify these levels as prices often bounce off the SMA line, treating it as a dynamic level of support or resistance. As an average of past prices, SMA is inherently a lagging indicator. This means it reflects what has already happened, not what is currently happening or will happen in the future. Therefore, signals generated by the SMA can be delayed, resulting in the late entry or exit points for traders. Another limitation of SMA is its susceptibility to false signals, particularly during periods of high market volatility. Since the SMA line smooths out price data, sudden price movements can result in significant deviations from the SMA, causing it to generate false trading signals. This can lead to unprofitable trades if not correctly managed. Unlike other moving averages like the Exponential Moving Average (EMA) or the Weighted Moving Average (WMA), the SMA gives equal weight to all data points in the period. This means it needs to be more responsive to recent price changes, which can be a disadvantage in fast-moving markets where timely information is crucial. The simple moving average (SMA) is the most common. It is calculated by taking the average of closing prices over a specified period. The SMA is a simple and easy-to-use indicator that can be used to identify trends and to smooth out price data. However, the SMA is also slow to react to changes in price, and it is less sensitive to recent price data than other moving averages. The exponential moving average (EMA) is a more complex moving average that gives more weight to recent prices. This makes the EMA more sensitive to changes in price, and it reacts more quickly to changes in price than the SMA. However, the EMA is also more complex to calculate than the SMA. The weighted moving average (WMA) is another type that assigns different weights to different price data points. This allows you to emphasize or de-emphasize specific price data points. The WMA is more complex to calculate than the SMA or EMA, but it can be a valuable tool for identifying trends and smoothing out price data. The triangular moving average (TMA) is a moving average that gives more weight to prices in the middle of the moving average period. This makes the TMA more sensitive to changes in price than the SMA, but it also smooths out price data without being as slow to react to changes as the SMA. The TMA is more complex to calculate than the SMA or EMA. The variable moving average (VMA) is a moving average that changes the weight of price data points based on volatility. This makes the VMA a valuable tool for identifying trends in volatile markets. However, the VMA is also more complex to calculate than the SMA, EMA, WMA, or TMA. One popular strategy is the moving average crossover, where two SMAs of different periods are plotted on the same chart. A buy signal is generated when the shorter-period SMA crosses above the longer-period SMA (bullish crossover). A sell signal is triggered when the shorter-period SMA crosses below the longer-period SMA (bearish crossover). Traders also use SMA in trend-following strategies, buying when prices are above the SMA and selling when prices fall below it. This strategy assumes prices will continue in the same direction as the established trend. The Simple Moving Average is a vital tool in financial analysis, providing a smoothed line that helps identify trends, support and resistance levels, and trading signals. However, like any tool, it has its strengths and weaknesses and should be used judiciously within a broader analytical framework. SMA is simple to calculate and widely used in financial markets. Its primary applications include trend identification, support and resistance level detection, and the creation of trading signals. However, it is a lagging indicator and may generate false signals, especially during periods of high market volatility. To effectively use SMA and other technical analysis tools, educating oneself and continually learning about market dynamics is essential. Consider seeking advice from financial advisors or wealth management professionals to help navigate the complexities of the financial markets and build a diversified portfolio that aligns with your financial goals.What Is the Simple Moving Average (SMA)?
Calculation of the Simple Moving Average
Formula and Parameters
Step-By-Step Process
1. Choose the Lookback Period: Determine the desired lookback period, which can be any specific number of days, such as 20, 50, or 200. This period indicates the number of previous closing prices to consider in the calculation.
2. Gather the Closing Prices: Collect the closing prices of the asset for the chosen lookback period. These closing prices can be obtained from historical or real-time market data.
3. Add the Closing Prices Together: Sum up all the closing prices gathered in the previous step.
4. Divide the Sum by the Number of Days: Divide the sum of the closing prices by the total number of days in the lookback period. This calculation yields the average price over the selected period.
5. Plot the Resulting SMA Value: Represent the calculated SMA value on a price chart. This helps visualize the trend by smoothing out short-term price fluctuations.Types of Simple Moving Averages
Description of Different Periods
Usage and Interpretation of Each Type
Application of Simple Moving Averages in Financial Analysis
Trend Identification
Support and Resistance Levels
Trading Signals
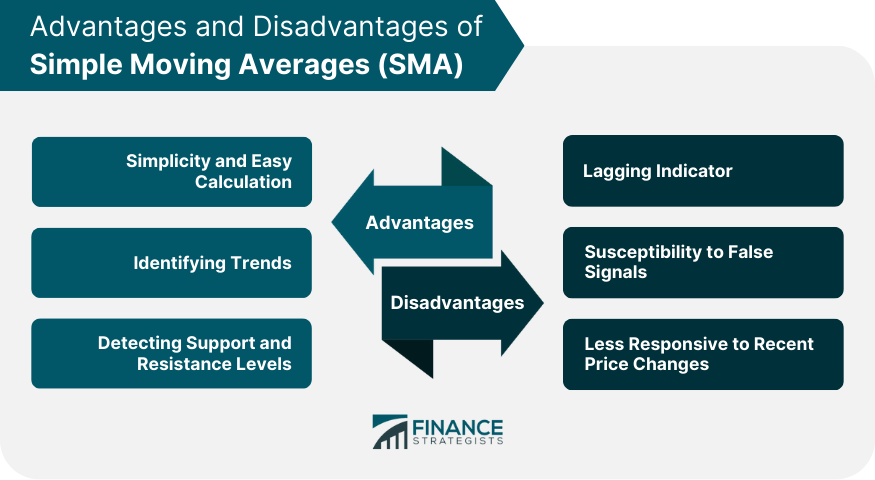
Advantages and Disadvantages of Simple Moving Averages
Benefits in Financial Analysis
Simplicity and Easy Calculation
Identifying Trends
Detecting Support and Resistance Levels
Limitations and Potential Pitfalls
Lagging Indicator
Susceptibility to False Signals
Less Responsive to Recent Price Changes
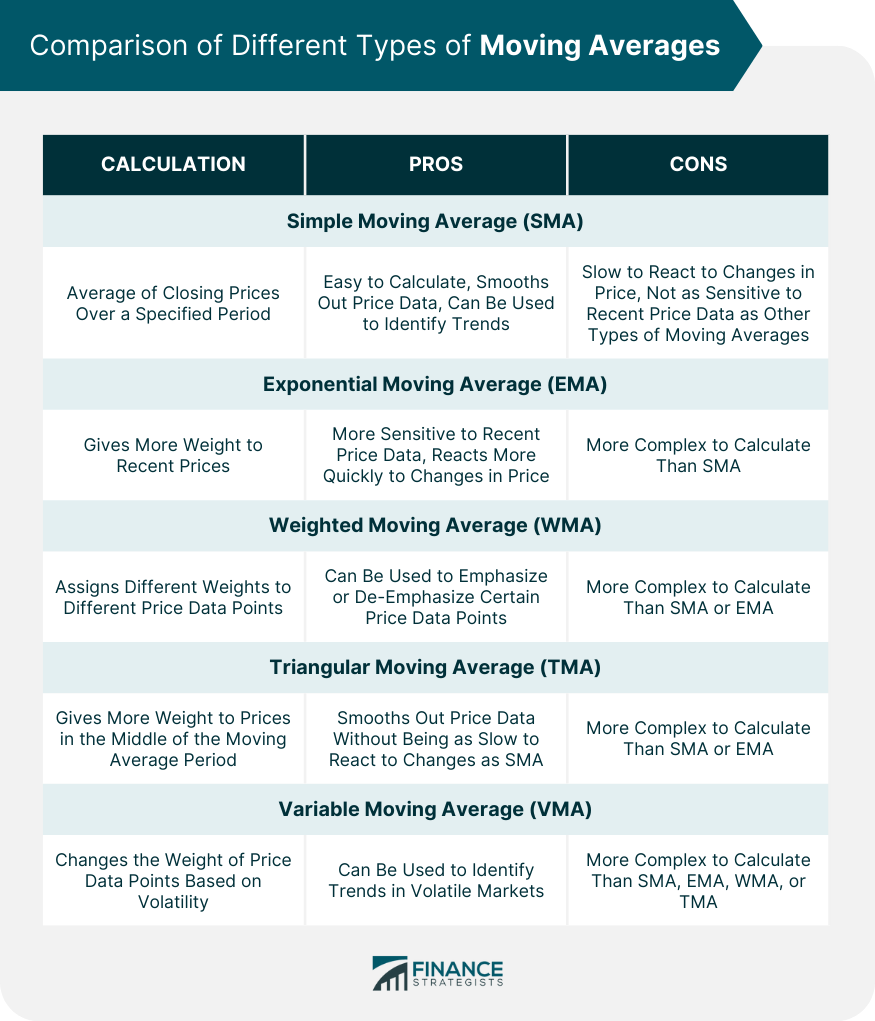
Comparison of Simple Moving Averages With Other Types of Moving Averages
Simple Moving Average (SMA)
Exponential Moving Average (EMA)
Weighted Moving Average (WMA)
Triangular Moving Average (TMA)
Variable Moving Average (VMA)
Using Simple Moving Averages in Trading Strategies
Crossover Strategies
Trend Following Strategies
Conclusion
Simple Moving Average (SMA) FAQs
Simple Moving Average (SMA) is a commonly used technical indicator in financial analysis that calculates the average price of an asset over a specific time.
The Simple Moving Average (SMA) is calculated by summing up the closing prices of an asset over a specified number of periods and then dividing it by the number of periods.
The advantage of using a Simple Moving Average (SMA) is its simplicity and ease of calculation, making it accessible to novice traders and investors.
Simple Moving Average (SMA) is a valuable tool for identifying price trends as it smooths out daily price fluctuations, providing a clearer picture of the prevailing trend over a given period.
Some limitations of Simple Moving Average (SMA) include being a lagging indicator, susceptibility to false signals during high market volatility, and needing to be more responsive to recent price changes than other moving averages.
True Tamplin is a published author, public speaker, CEO of UpDigital, and founder of Finance Strategists.
True is a Certified Educator in Personal Finance (CEPF®), author of The Handy Financial Ratios Guide, a member of the Society for Advancing Business Editing and Writing, contributes to his financial education site, Finance Strategists, and has spoken to various financial communities such as the CFA Institute, as well as university students like his Alma mater, Biola University, where he received a bachelor of science in business and data analytics.
To learn more about True, visit his personal website or view his author profiles on Amazon, Nasdaq and Forbes.


