
The inverse head and shoulders, or the head and shoulders bottom, is a popular chart pattern used in technical analysis. It represents a bullish signal suggesting a potential reversal of a current downtrend. The pattern comprises three main components, with two lows (shoulders) on either side of a lower low (head), indicating the weakening of the bearish trend and the potential for a new upward trend. Chart patterns form the bedrock of technical analysis, enabling traders to predict future price movements based on historical data. The inverse head and shoulders pattern is one of many such patterns that traders look out for when analyzing price charts. Like others, this pattern indicates market psychology and investor sentiment, providing insights into the potential future direction of price movement. Technical analysis is a trading tool employed to evaluate securities and identify trading opportunities by analyzing statistics gathered from trading activity, such as price movement and volume. In this context, the inverse head and shoulders pattern is crucial. It is a reliable trend reversal pattern that allows traders to anticipate potential bullish reversals in a price chart, thereby informing trading decisions. This part of the pattern is characterized by a price decline followed by a bottom, leading to a subsequent rally. This forms the first trough, often reflecting a period of selling pressure. Following the left shoulder, prices rise to form a peak before falling again to create the lowest point in the pattern. This point is known as the "head" and is often the result of the selling pressure intensifying momentarily. After the head, prices rally again before dropping to form the final trough, which is the "right shoulder". This is typically less severe than the head, indicating weakening selling pressure. Connecting the peaks formed after forming the left shoulder, head, and right shoulder, the "neckline" is a crucial part of the pattern. A break above the neckline often signifies a trend reversal from bearish to bullish. A trader can identify an inverse head and shoulders pattern by noting three successive troughs, with the middle one being the deepest and the two others being roughly equal in depth. A key criterion is breaking the neckline by the price, which signals the completion of the pattern. While the shape of the pattern is vital, the volume also plays an important role in confirming an inverse head and shoulders pattern. Ideally, volume during the advance of the right shoulder should be higher than during the formation of the left shoulder and the head, offering further evidence of a coming bullish reversal. The time frame for an inverse head and shoulders pattern can range from several weeks to several months. However, it's worth noting that longer patterns tend to be more reliable. Shorter time frames may lead to more false signals. The primary significance of an inverse head and shoulders pattern is its indication of a potential trend reversal. A complete pattern confirms that the market's downward trend has been arrested, and a new upward trend is starting. The inverse head and shoulders pattern also offers traders predictive power regarding future price movements. The difference in price between the head and the neckline often provides a target for the subsequent bullish move after the pattern is completed. Drawing an inverse head and shoulders pattern requires a keen eye and a good understanding of its structure. Here are step-by-step guidelines to draw this pattern: 1. Identify the Left Shoulder: The pattern starts with a fall in prices. This drop reaches a trough, creating the left shoulder, followed by a rise leading to a peak. 2. Spot the Head: Prices decline to form a deeper trough after the left shoulder's peak, creating the pattern's head. This should be the lowest point in the current trend. 3. Mark the Right Shoulder: Subsequently, prices rally again to form a peak and then fall to form another trough. This final trough is the right shoulder. The right shoulder's depth is usually less than the head's, indicating decreased selling pressure. 4. Draw the Neckline: The neckline is an essential component of the pattern. Draw a line connecting the peaks after the formation of the left shoulder, head, and right shoulder. The breaking of this line by the prices signifies the completion of the pattern and the possible start of a new bullish trend. The neckline is a crucial inverse head and shoulders resistance point. It is drawn by connecting the high points (peaks) after each trough (shoulder and head). Proper identification of the neckline is vital because it acts as the breakout point for the pattern. The slope of the neckline can vary - it can be horizontal or sloping either upwards or downwards. Regardless of the slope, when the price breaks through this line, it strongly signals a bullish trend reversal. This break is typically accompanied by an increase in volume, providing additional confirmation of the trend reversal. However, traders should note that the pattern is not confirmed until the price breaks above the neckline, emphasizing the importance of correctly identifying this crucial line. Misidentifying the neckline can lead to an incorrect interpretation of the pattern and potential trading losses. Completing an inverse head and shoulders pattern presents a potential entry point for traders. This occurs when prices break above the neckline, indicating the potential start of a new bullish trend. To manage potential losses, traders often set stop-loss orders. A common approach with the inverse head and shoulders pattern is to set the stop-loss just below the right shoulder. The trade is automatically closed to limit losses if the price falls below this point. Traders typically set profit targets based on the height of the pattern. The vertical distance from the neckline to the bottom of the head can be projected upwards from the neckline break, providing a price target for the subsequent bullish move. The inverse head and shoulders can produce false signals like any other chart pattern. Traders may think they see a pattern forming, only for the price to move unpredictably. This risk is especially pronounced in shorter time frames. Market volatility can also affect the reliability of the inverse head and shoulders pattern. In highly volatile markets, patterns can form and dissolve quickly, leading to potential losses for traders. While the inverse head and shoulders pattern can be a powerful tool, it shouldn't be used in isolation. Combining it with other technical analysis tools and indicators can increase the chances of successful trades. While the inverse head and shoulders pattern is a bullish trend reversal pattern, the regular head and shoulders pattern is a bearish trend reversal pattern. The regular pattern consists of a peak (left shoulder), followed by a higher peak (head), and then another peak (right shoulder), with the latter two being approximately equal in height. The double top and double bottom patterns are also reversal patterns but are simpler in structure. The double top is a bearish reversal pattern, while the double bottom is bullish. These patterns are identified by two peaks or troughs, respectively, as opposed to the three in the head and shoulders patterns. Triangle patterns are continuation patterns, differing from the head and shoulders patterns which are reversal patterns. Triangle patterns represent a period of consolidation before the price is forced to break out or break down due to tightening price action. The inverse head and shoulders is a powerful chart pattern in technical analysis, indicating a potential bullish reversal. Its formation - two equal troughs (shoulders) surrounding a lower trough (head) - is a strong signal of a shift in market sentiment from bearish to bullish. Accurate pattern identification, appropriate entry points, setting stop losses, and profit targets are crucial components of a successful trading strategy involving the inverse head and shoulders pattern. However, it's essential to be aware of the pattern's limitations and risks, including the possibility of false signals and the impact of market volatility. While the inverse head and shoulders pattern is valuable, it should be just one component of a broader investment strategy. Combining it with other technical indicators and fundamental analysis can lead to more robust, profitable trading decisions. Trading is an evolving field that requires continuous learning and adaptation. Recognizing patterns like the inverse head and shoulders is just the beginning. As markets change and new tools become available, traders must stay informed and flexible. In the world of trading, knowledge is power. You can take control of your financial future by learning to spot patterns like the inverse head and shoulders. So why wait? Start exploring the world of technical analysis and chart patterns today, and make your money work harder for you.What Is the Inverse Head and Shoulders?
Structure of Inverse Head and Shoulders
The Left Shoulder
The Head
The Right Shoulder
The Neckline
Identifying the Inverse Head and Shoulders Pattern
Criteria for Identifying the Pattern
Importance of Volume in Confirmation
Role of Time Frame in Analysis
Significance of the Inverse Head and Shoulders Pattern
Indication of Trend Reversals
Predictive Power for Price Movements
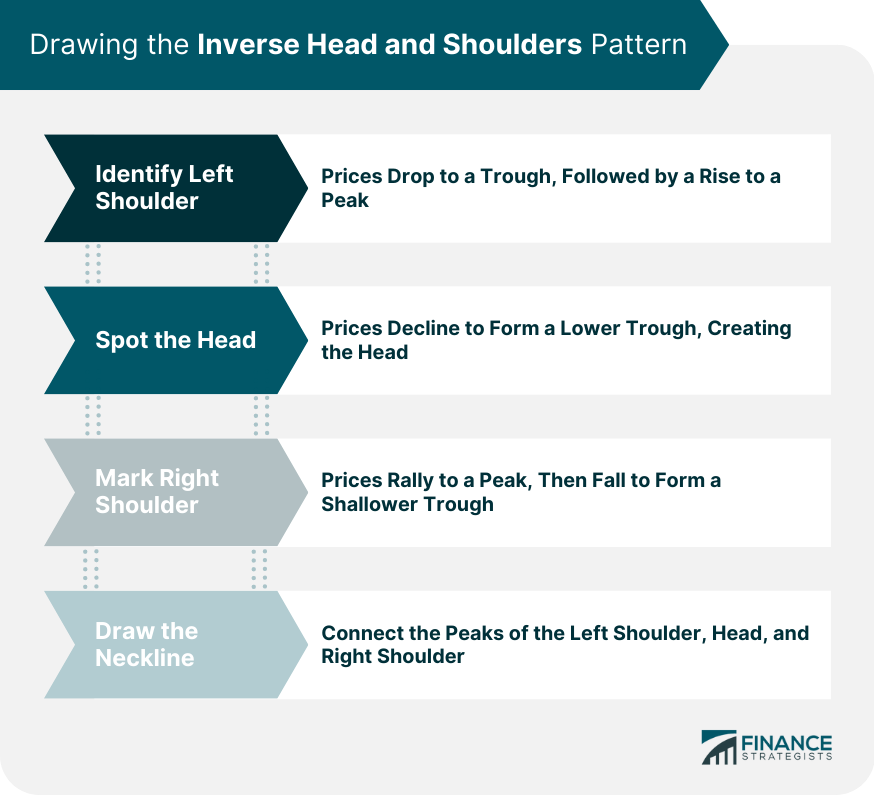
Drawing the Inverse Head and Shoulders Pattern
Guidelines for Drawing the Pattern
Identifying the Neckline
Trading Strategies Using the Inverse Head and Shoulders Pattern
Entry Points
Setting Stop Losses
Profit Targets
Limitations and Risks of the Inverse Head and Shoulders Pattern
False Signals and Misinterpretations
Market Volatility and Impact on Pattern
Need for Supplementary Analysis
Comparing the Inverse Head and Shoulders With Other Chart Patterns
Versus Regular Head and Shoulders
Versus Double Top/Double Bottom Patterns
Versus Triangle Patterns
Conclusion
Inverse Head And Shoulders FAQs
The inverse head and shoulders pattern is a bullish trend reversal chart pattern. It is identified by three successive troughs, with the middle being the deepest (the head) and the other approximately equal in depth (the shoulders).
Volume can provide additional confirmation of an inverse head and shoulders pattern. Ideally, the volume should increase during the formation of the right shoulder and the breakout above the neckline, indicating strong buying pressure.
Profit targets are typically set based on the height of the pattern. You can measure the vertical distance from the neckline to the bottom of the head and then project this distance upwards from the neckline break to get a price target.
Some potential limitations of the inverse head and shoulders pattern include the possibility of false signals, particularly in shorter time frames, and the impact of market volatility, which can lead to the rapid formation and dissolution of patterns.
The inverse head and shoulders is a bullish reversal pattern, indicating a potential shift from a downward to an upward trend. This contrasts with bearish reversal patterns like the regular head and shoulders and continuation patterns like triangle patterns.
True Tamplin is a published author, public speaker, CEO of UpDigital, and founder of Finance Strategists.
True is a Certified Educator in Personal Finance (CEPF®), author of The Handy Financial Ratios Guide, a member of the Society for Advancing Business Editing and Writing, contributes to his financial education site, Finance Strategists, and has spoken to various financial communities such as the CFA Institute, as well as university students like his Alma mater, Biola University, where he received a bachelor of science in business and data analytics.
To learn more about True, visit his personal website or view his author profiles on Amazon, Nasdaq and Forbes.


