
The Intraday Momentum Index is a technical analysis indicator that measures the momentum of price movements during a single trading day. It combines price and volume data to provide a comprehensive view of market strength or weakness. This indicator is primarily used by day traders to identify potential entry and exit points in volatile markets. The Intraday Momentum Index was developed by Tushar Chande, a well-known trader and author, in the early 1990s. Chande sought to create an indicator that could provide reliable insights into intraday price movements, offering an advantage over other momentum-based indicators that focused on longer time frames. The IMI is widely used in trading and investing as a tool for identifying short-term trends, capturing price reversals, and generating buy or sell signals. It is particularly useful in fast-moving markets, where rapid shifts in momentum can signal potential trading opportunities. The IMI calculation takes into account the high and low prices of a security during the trading day. These values represent the maximum and minimum prices at which the security was traded during the specified period. Additionally, the IMI uses the close and open prices of a security to gauge the overall price change during the trading day. The close price represents the final trading price of the security at the end of the day, while the open price refers to the first traded price when the market opens. Trading volume is a crucial component of the IMI, as it reflects the level of interest and activity in a particular security. A strong correlation between price changes and trading volume often indicates a high degree of market conviction behind those price movements. Incorporating trading volume into the IMI calculation allows the indicator to provide a more accurate representation of market momentum. By considering both price and volume data, the IMI can filter out potential false signals that may arise due to low trading activity or other market anomalies. The formula for calculating the IMI is as follows: Where Gains represent the sum of positive price changes multiplied by their respective trading volumes, and Losses represent the sum of negative price changes multiplied by their respective trading volumes. To calculate the IMI, traders must first gather the necessary data inputs, which include the high, low, open, and close prices, as well as the trading volume for the security in question. Next, traders must compute the price differences by subtracting the open price from the high price and the low price from the open price. This step provides the necessary gains and losses data for the IMI calculation. Finally, traders must calculate the IMI values by dividing the sum of gains by the total of gains and losses and multiplying the result by 100. The resulting values typically range between 0 and 100, with higher values indicating stronger upward momentum and lower values suggesting downward momentum. The IMI can provide overbought and oversold signals, which indicate potential trend reversals. Generally, IMI values above 70 are considered overbought, suggesting that the security may be due for a price decline, while values below 30 are considered oversold, implying that the price may soon rise. Divergence and convergence are two key concepts in interpreting IMI values. If the IMI is rising while the price is falling (or vice versa), this divergence may signal a potential trend reversal. On the other hand, if the IMI and price are moving in the same direction, this convergence may confirm the current trend. The IMI can help traders identify bullish and bearish trends. When the IMI is above 50 and rising, it may indicate a bullish trend, while an IMI below 50 and falling may signal a bearish trend. By examining the IMI's relative position and movement, traders can gauge the strength and duration of the identified trends. A higher or lower IMI, along with its persistence in those areas, can indicate a strong and prolonged trend. One common trading strategy using the IMI involves crossovers. When the IMI crosses above 70, it may provide a sell signal, while a cross below 30 may provide a buy signal. Another strategy involves trading on divergences between the IMI and price. If the IMI is rising while the price is falling, it may provide a buy signal, while a falling IMI during a rising price may provide a sell signal. Traders often use the IMI in conjunction with moving averages to confirm trends and generate trade signals. A rising IMI accompanied by a price above the moving average may confirm a bullish trend, while a falling IMI with a price below the moving average may confirm a bearish trend. The Relative Strength Index (RSI) and stochastic indicators are two other technical analysis tools that traders may use alongside the IMI. These indicators can provide additional insights into market momentum and potential overbought or oversold conditions. Volume-based indicators such as the On-Balance Volume (OBV) or the Money Flow Index (MFI) can complement the IMI by providing further insights into the relationship between price and volume. A divergence between these volume-based indicators and the IMI could signal potential trading opportunities. Like any technical indicator, the IMI can generate false signals, particularly in choppy or sideways markets. Traders should therefore use the IMI in conjunction with other analysis tools and strategies to improve its accuracy and reliability. The IMI relies heavily on historical price and volume data. While this data can provide valuable insights into past market behavior, it may not always accurately predict future movements. The IMI can be influenced by various external factors such as market volatility, economic news, and changes in investor sentiment. Traders should be aware of these factors and adjust their strategies accordingly. Traders can enhance the effectiveness of the IMI by adjusting the time frame to match their trading style. For instance, shorter time frames may be more suitable for day traders, while longer time frames may be more applicable for swing traders. The IMI's parameters can be customized to better suit a trader's needs. For example, changing the overbought and oversold thresholds can help traders adapt to different market conditions. Using additional technical analysis tools alongside the IMI can provide more comprehensive market insights. Tools such as trend lines, support and resistance levels, and other technical indicators can help traders confirm IMI signals and enhance their trading strategies. The IMI should not be used in isolation but rather as part of a comprehensive trading strategy that incorporates other technical indicators, fundamental analysis, and risk management techniques. Traders should always confirm IMI signals with other market indicators or analysis tools before executing a trade. This can help reduce the likelihood of false signals and improve overall trading performance. Understanding the broader market context is crucial when using the IMI. Factors such as market trends, volatility, and economic news can all influence the accuracy and relevance of IMI signals. The Intraday Momentum Index is a popular technical analysis indicator used by day traders to measure momentum during a single trading day. It combines price and volume data to identify potential entry and exit points in volatile markets. The IMI's calculation takes into account price changes, high and low prices, close and open prices, and trading volume. Traders interpret IMI values for overbought and oversold signals, divergence and convergence, and trend identification. Strategies involving crossovers, divergences, and combining the IMI with other technical indicators such as moving averages, RSI, stochastic indicators, and volume-based indicators are commonly employed. However, it's important to consider limitations such as false signals, dependence on historical data, and the impact of market volatility and external factors. Traders are advised to use the IMI as part of a comprehensive trading strategy, confirm signals with other indicators, and understand the broader market context. Seeking professional advice is recommended to gain a deeper understanding of the IMI and its application in trading.What Is the Intraday Momentum Index (IMI)?
Components of the Intraday Momentum Index
Price Changes
High and Low Prices
Close and Open Prices
Trading Volume
Relationship With Price Changes
Significance in IMI Calculation
Calculation of the Intraday Momentum Index
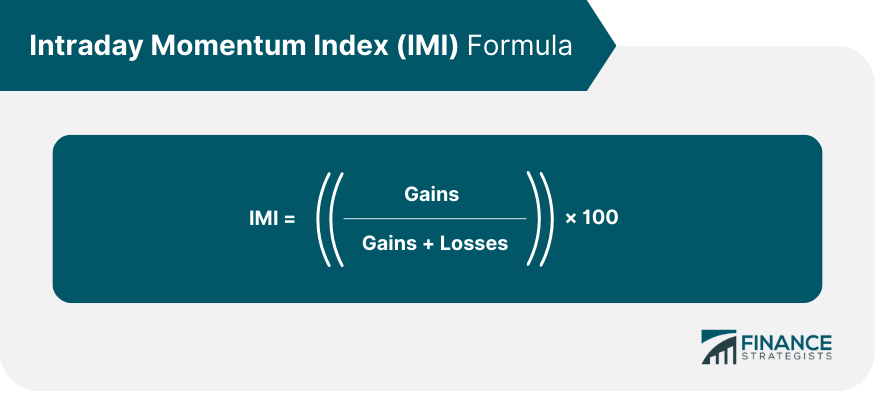
Formula and Components
Step-By-Step Process
Identifying Data Inputs
Computing Price Differences
Calculating IMI Values
Interpretation of the Index Values
Overbought and Oversold Signals
Divergence and Convergence
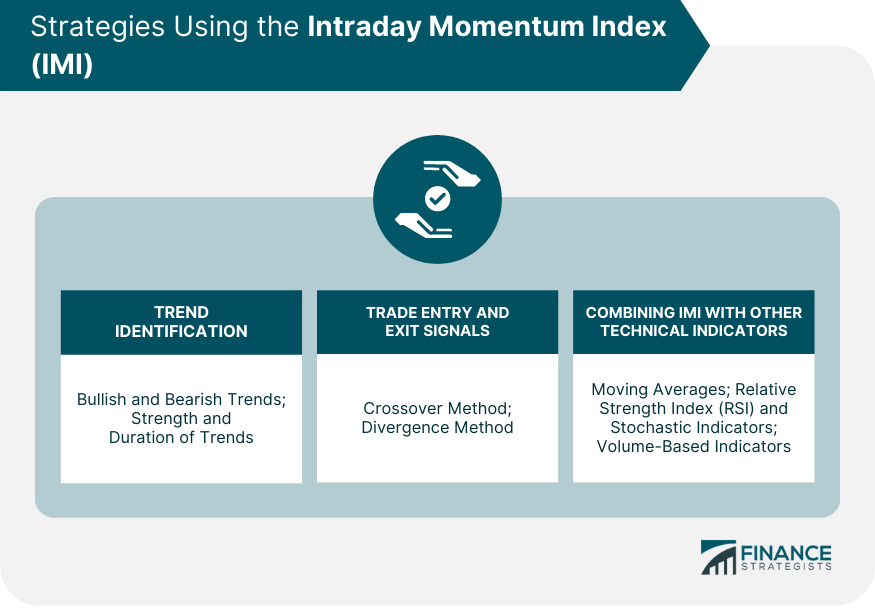
Strategies Using the Intraday Momentum Index
Trend Identification
Bullish and Bearish Trends
Strength and Duration of Trends
Trade Entry and Exit Signals
Crossover Method
Divergence Method
Combining IMI With Other Technical Indicators
Moving Averages
RSI and Stochastic Indicators
Volume-Based Indicators
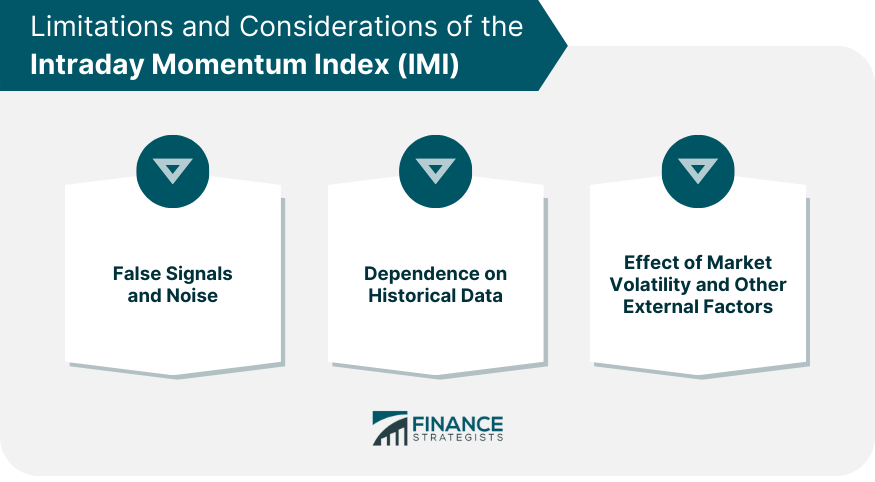
Limitations and Considerations of the Intraday Momentum Index
False Signals and Noise
Dependence on Historical Data
Effect of Market Volatility and Other External Factors
Enhancing Intraday Momentum Index Effectiveness
Adjusting the Time Frame
Customizing Parameters
Utilizing Additional Technical Analysis Tools
Best Practices in Using Intraday Momentum Index
Use the IMI as Part of a Comprehensive Trading Strategy
Always Confirm IMI Signals
Understand Market Context
Final Thoughts
Intraday Momentum Index (IMI) FAQs
The IMI is a technical analysis indicator that measures the momentum of price movements during a single trading day. It combines price and volume data to provide a comprehensive view of market strength or weakness.
The IMI is calculated using a formula that takes into account the high, low, open, and close prices of a security, as well as its trading volume. The resulting values typically range between 0 and 100.
IMI values above 70 are generally considered overbought, suggesting a potential price decline, while values below 30 are considered oversold, indicating a potential price rise. Values above 50 may indicate a bullish trend, while values below 50 may signal a bearish trend.
Like any technical indicator, the IMI can generate false signals, particularly in choppy or sideways markets. It also relies heavily on historical data and can be influenced by external factors such as market volatility and economic news.
You can enhance the IMI's effectiveness by adjusting the time frame, customizing parameters, and using additional technical analysis tools. It's also important to confirm IMI signals with other indicators and understand the broader market context.
True Tamplin is a published author, public speaker, CEO of UpDigital, and founder of Finance Strategists.
True is a Certified Educator in Personal Finance (CEPF®), author of The Handy Financial Ratios Guide, a member of the Society for Advancing Business Editing and Writing, contributes to his financial education site, Finance Strategists, and has spoken to various financial communities such as the CFA Institute, as well as university students like his Alma mater, Biola University, where he received a bachelor of science in business and data analytics.
To learn more about True, visit his personal website or view his author profiles on Amazon, Nasdaq and Forbes.


