
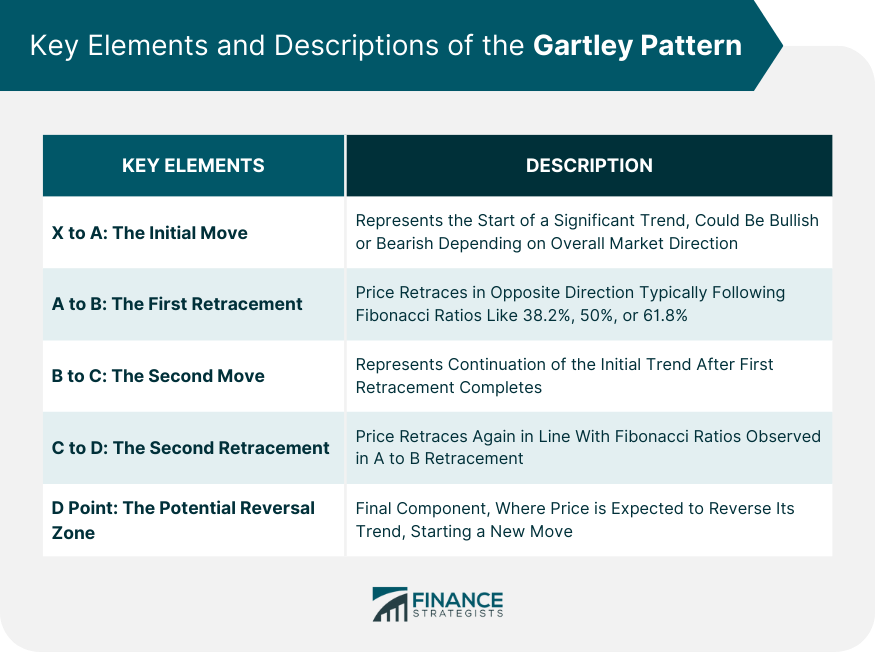
The Gartley Pattern is a harmonic trading pattern that seeks to identify potential market reversals. It is named after its creator, H.M. Gartley, who introduced the pattern in his book "Profits in the Stock Market" in 1935. The Gartley Pattern is based on Fibonacci ratios and geometric proportions. It consists of specific price movements and retracements, forming a unique pattern that indicates a potential reversal in the current trend. Traders use the Gartley Pattern to identify opportunities for entering or exiting trades, aiming to capitalize on market reversals and profit from the subsequent price movements. The Gartley Pattern holds significant importance in wealth management as it provides traders with a systematic approach to identifying potential market reversals. By recognizing the pattern's structure and key elements, traders can make informed decisions about market entry and exit points, manage risk effectively, and enhance their overall trading strategies. The Gartley Pattern's reliance on Fibonacci ratios reflects its connection to the natural mathematical relationships observed in financial markets. This adds an element of objectivity and credibility to the pattern's analysis, allowing traders to have a systematic approach to wealth management. The Gartley Pattern begins with the initial move, labeled as X to A. This move represents the start of a significant trend. It can be a bullish or bearish move, depending on the overall market direction. After the initial move, the price retraces in the opposite direction. This retracement is labeled as A to B. The retracement typically follows the Fibonacci ratios, such as 38.2%, 50%, or 61.8% retracement of the initial move. Once the first retracement completes, the price resumes its original direction with the second move, labeled as B to C. This move represents the continuation of the initial trend. Following the second move, the price retraces again, forming the second retracement labeled as C to D. This retracement is typically in line with the Fibonacci ratios observed in the A to B retracement. The D point is the final component of the Gartley Pattern. It represents the potential reversal zone where the price is expected to reverse its current trend and start a new move. Traders look for specific confluences at the D point, such as Fibonacci ratios, support or resistance levels, or candlestick patterns, to confirm the potential reversal. By understanding the structure and key elements of the Gartley Pattern, traders can identify potential market reversals and time their trades to take advantage of these turning points. The Gartley Pattern has significant implications for wealth management. It provides traders with a structured approach to identifying potential market reversals and offers valuable insights into entry and exit points. Traders can use the pattern to optimize their trading strategies, enhance risk management, and improve their overall profitability. By recognizing the specific characteristics of the Gartley Pattern, such as the retracements and potential reversal zones, traders can make informed decisions based on objective criteria. This allows for a systematic and disciplined approach to wealth management. The Gartley Pattern can be both bullish and bearish, depending on the overall market direction. A bullish Gartley Pattern occurs when the initial move is bullish, while a bearish Gartley Pattern occurs when the initial move is bearish. Traders can identify these patterns by carefully analyzing the price structure and key elements of the pattern. The specific retracements and ratios observed in the A to B and C to D segments help determine whether the pattern is bullish or bearish. This information is crucial for traders in formulating their trading strategies and capitalizing on potential market reversals. Fibonacci numbers and ratios play a significant role in the Gartley Pattern. The retracements and potential reversal zones of the pattern align with these ratios, such as 38.2%, 50%, and 61.8%. These ratios reflect the natural mathematical relationships observed in financial markets and provide traders with objective criteria for identifying potential reversal points. The Fibonacci ratios act as guidelines for determining the validity and strength of the Gartley Pattern. Traders can use these ratios in combination with other technical analysis tools to validate the pattern and confirm potential trading opportunities. Effective risk management is crucial when using the Gartley Pattern. Traders should always consider placing stop-loss orders to protect their capital in case the price does not reverse as anticipated. Stop-loss orders help traders limit their potential losses and exit trades if the price moves against the expected reversal. By setting appropriate stop-loss levels based on the structure of the Gartley Pattern, traders can control their risk exposure and protect their trading capital. Traders can employ various strategies for managing risk when utilizing the Gartley Pattern. One common approach is to use a trailing stop-loss order that adjusts as the price moves in the anticipated direction. This allows traders to protect profits while giving the price room to continue its potential reversal. Another risk management strategy is to use position sizing techniques that align with the anticipated profit potential and risk-reward ratio of the Gartley Pattern trades. By carefully managing their position sizes, traders can control the amount of risk taken on each trade and optimize their overall risk management approach. Implementing proper risk management techniques is essential to preserve capital and ensure long-term success when trading the Gartley Pattern. The Gartley Pattern is widely used in forex trading due to the high liquidity and volatility of the forex market. Traders can apply the Gartley Pattern to various currency pairs and timeframes to identify potential reversals and profit opportunities. Forex traders can combine the Gartley Pattern with other technical analysis tools, such as trend lines, support and resistance levels, and oscillators, to enhance their trading strategies and increase the probability of successful trades. The Gartley Pattern is also applicable to stock trading. Traders can apply the pattern to individual stocks or stock indices to identify potential reversals and profit from price movements. Stock traders often combine the Gartley Pattern with fundamental analysis and other technical indicators to validate potential trade opportunities. This comprehensive approach helps traders make more informed decisions and optimize their stock trading strategies. In addition to forex and stocks, the Gartley Pattern can be applied to various financial markets, including commodities, futures, and cryptocurrencies. The pattern's reliance on Fibonacci ratios and geometric proportions makes it a versatile tool for identifying potential reversals in different market environments. Traders in these markets can utilize the Gartley Pattern alongside other relevant technical analysis tools to gain insights into market trends and potential trading opportunities. One criticism of the Gartley Pattern is the potential subjectivity in identifying the pattern's structure and key elements. Traders may have different interpretations or variations of the pattern, which can lead to inconsistencies in trade selection and execution. To address this limitation, traders should establish clear criteria for recognizing and confirming the Gartley Pattern. This may involve using additional technical analysis tools or waiting for specific price action confirmation before entering trades based on the pattern. The Gartley Pattern may face limitations in volatile or illiquid markets. Rapid price movements or insufficient trading volume can affect the accuracy and reliability of the pattern's signals. Traders should exercise caution when applying the Gartley Pattern in such market conditions. It may be necessary to adjust risk management parameters, widen stop-loss levels, or wait for more favorable market conditions before executing trades based on the pattern. The Gartley Pattern is a harmonic trading pattern used to identify potential market reversals. It relies on Fibonacci ratios and geometric proportions to determine specific price movements and retracements, culminating in a potential reversal zone. The Gartley Pattern holds significant implications for wealth management, allowing traders to identify potential market reversals, differentiate between bullish and bearish patterns, and leverage Fibonacci numbers to validate trading opportunities. The Gartley Pattern can be applied in various financial markets, such as forex and stocks, to identify potential reversals and profit from price movements. Traders can combine the pattern with other technical analysis tools to enhance their trading strategies and increase the probability of successful trades. While the Gartley Pattern offers valuable insights, it is not without limitations. Concerns about subjectivity in pattern identification and limitations in volatile or illiquid markets should be considered when utilizing the pattern in trading decisions.What Is the Gartley Pattern?
The Significance of the Gartley Pattern
Structure and Key Elements of the Gartley Pattern
X to A: The Initial Move
A to B: The First Retracement
B to C: The Second Move
C to D: The Second Retracement
D Point: The Potential Reversal Zone
Interpreting the Gartley Pattern
Implications of the Pattern for Wealth Management
Identifying Bullish and Bearish Gartley Patterns
The Role of Fibonacci Numbers in the Gartley Pattern
Gartley Pattern and Risk Management
Importance of Stop-Loss Orders in Using the Gartley Pattern
Strategies for Managing Risk With the Gartley Pattern
Practical Applications of the Gartley Pattern
Gartley Pattern in Forex Trading
Gartley Pattern in Stock Trading
Other Financial Markets Where the Gartley Pattern Can Be Applied
Criticisms and Limitations of the Gartley Pattern
Concerns About Subjectivity in Identifying the Pattern
Limitations in Volatile or Illiquid Markets
Conclusion
Gartley Pattern FAQs
The Gartley Pattern is a harmonic trading pattern used to identify potential market reversals. It is based on Fibonacci ratios and consists of specific price movements and retracements.
The Gartley Pattern is interpreted by analyzing its structure and key elements, such as the initial move, retracements, and potential reversal zones. Traders use these elements to identify potential market reversals and make trading decisions.
The Gartley Pattern can be used for risk management by implementing appropriate stop-loss orders to limit potential losses. Traders can also employ position sizing techniques and trailing stop-loss orders to manage risk effectively.
The Gartley Pattern can be applied in various financial markets, including forex, stocks, commodities, futures, and cryptocurrencies.
The Gartley Pattern has limitations in terms of subjectivity in pattern identification and its applicability in volatile or illiquid markets. Traders should be mindful of these limitations and exercise caution when using the pattern in trading decisions.
True Tamplin is a published author, public speaker, CEO of UpDigital, and founder of Finance Strategists.
True is a Certified Educator in Personal Finance (CEPF®), author of The Handy Financial Ratios Guide, a member of the Society for Advancing Business Editing and Writing, contributes to his financial education site, Finance Strategists, and has spoken to various financial communities such as the CFA Institute, as well as university students like his Alma mater, Biola University, where he received a bachelor of science in business and data analytics.
To learn more about True, visit his personal website or view his author profiles on Amazon, Nasdaq and Forbes.


