
An envelope is a type of trading band that plots lines above and below a moving average of security prices. It is a technical analysis tool that helps to identify the upper and lower limits of price fluctuations. It enables traders to understand the market's volatility and potential areas of resistance or support. The envelope's concept is based on the principle that prices tend to return to their baseline, despite short-term deviations. It provides a range within which the price of a security may fluctuate. When a price steps outside of its envelope, it may indicate a buying or selling opportunity. The upper band of the envelope is set at a specific distance above the central moving average. The distance is typically a percentage of the moving average price. It's an area where prices are relatively high, which can often signal an overbought condition. The lower band, on the other hand, is a certain distance below the moving average. Similar to the upper band, the lower band's distance is usually a percentage of the moving average price. This area signifies where prices are relatively low, often signaling an oversold condition. The central moving average is the middle line around which the envelope is formed. It can be a simple, exponential, weighted, or variable moving average, depending on the trader's preferences and strategy. To calculate the envelope, first decide on a moving average length, such as a 20-day simple moving average. Then, determine a fixed percentage to create the bands. For example, if you set a 2% envelope, the upper band will be 2% above the moving average, and the lower band will be 2% below it. The envelope serves as a method of identifying the trading range of a security. When the price breaks through the upper band, it may be an indication that the security is overbought and due for a price correction. Conversely, when the price dips below the lower band, it could indicate that the security is oversold and may soon experience a price increase. The SMA envelope is the most basic form. It utilizes a simple moving average as its central line, with the upper and lower bands set at a fixed percentage away from this. The EMA envelope is similar to the SMA envelope but uses an exponential moving average, giving more weight to recent prices. This makes it more sensitive to recent price changes and might be preferred by short-term traders. The WMA envelope uses a weighted moving average, which assigns more importance to recent data, much like the EMA envelope. The key difference is in the calculation of the averages. The VMA envelope adjusts the moving average to the market's volatility. It changes the envelope's width based on the market's volatility, which can be useful in markets with significant price swings. Envelopes can assist traders in identifying overall market trends. If prices are consistently near or touching the upper envelope, this could indicate a strong uptrend. Conversely, if prices are often near or at the lower envelope, it could suggest a downward trend. By defining a range where prices typically move, envelopes can help identify potential overbought or oversold conditions. If the price breaks above the upper envelope, the asset may be overbought. On the other hand, a break below the lower envelope may suggest the asset is oversold. Changes in the width of the envelope can indicate changes in volatility. Wider envelopes typically signify greater price volatility, while narrower envelopes suggest lower volatility. Using the envelope strategy, a buy signal is usually generated when the price of a security reaches the lower band, suggesting an oversold condition. This suggests that the price may soon rise, providing a potentially good opportunity to buy. Conversely, a sell signal is often given when the price touches the upper band, indicating an overbought condition. This suggests that the price may soon fall, potentially creating a good opportunity to sell. As with any trading strategy, risk management is crucial. Traders should consider using stop losses to protect against significant losses if the price does not move as expected. Combining envelopes with volume indicators can enhance trading signals. For example, a break above the upper envelope combined with high trading volume may strengthen the validity of a sell signal. Momentum oscillators like the Relative Strength Index (RSI) or the Stochastic Oscillator can be used in conjunction with envelopes to confirm overbought or oversold signals. Chart patterns can also provide valuable insights when used with envelopes. For instance, a price breakout from a recognized chart pattern along with a breach of an envelope could provide a strong trading signal. Prices can break through the upper or lower band due to temporary market fluctuations or "noise," rather than a substantial shift in the trend. This can lead to false buy or sell signals, potentially resulting in unprofitable trades. For instance, during periods of high market volatility, prices might frequently breach the envelope, generating multiple buy and sell signals. However, these may not necessarily indicate a sustainable trend change but rather the market's temporary reaction to recent news or events. Relying solely on such signals might lead to losses, especially if the price quickly reverses. The Envelope is created by setting upper and lower bands at a specific distance from a central moving average. This distance is often defined as a percentage of the price. However, choosing the appropriate percentage and the type and length of the moving average is crucial, as different settings may produce vastly different signals. For example, a smaller percentage might result in the bands being breached too often, leading to numerous false signals. A higher percentage might make the bands too wide, resulting in fewer signals, and potentially causing missed trading opportunities. Similarly, the choice of the moving average type and length can greatly impact the signals generated by the Envelope. The Envelope can also be less effective in highly volatile markets. In such situations, price swings can be so significant that they frequently breach the bands of the Envelope. This can produce many potential buy and sell signals, complicating the decision-making process and possibly leading to hasty and ill-timed trades Furthermore, rapid changes in volatility can also make it challenging to set appropriate parameters for the Envelope. As volatility increases, a previously suitable percentage distance might become too narrow, causing frequent band breaches. On the other hand, as volatility decreases, the same percentage might become too wide, resulting in fewer signals. The Envelope is a versatile technical analysis tool that can provide valuable insights into market trends, potential overbought and oversold conditions, and changes in volatility. By identifying the trading range of a security and providing potential buy and sell signals, it can serve as a powerful addition to a trader's toolkit. Different types of Envelopes—SMA, EMA, WMA, and VMA—provide flexibility, allowing traders to adapt the tool to various market conditions and their individual trading strategies. When used in conjunction with other technical analysis tools such as volume indicators, momentum oscillators, and chart patterns, the Envelope can offer even more robust signals, enhancing its utility in trading decisions. However, as with all technical analysis tools, the Envelope is not foolproof and comes with its set of limitations and potential pitfalls. False signals due to market noise, dependence on appropriate parameter selection, and limitations in highly volatile markets underscore the need for careful usage and risk management. Understanding and navigating these pitfalls can significantly enhance the effective use of the Envelope in technical analysis.What Is an Envelope?
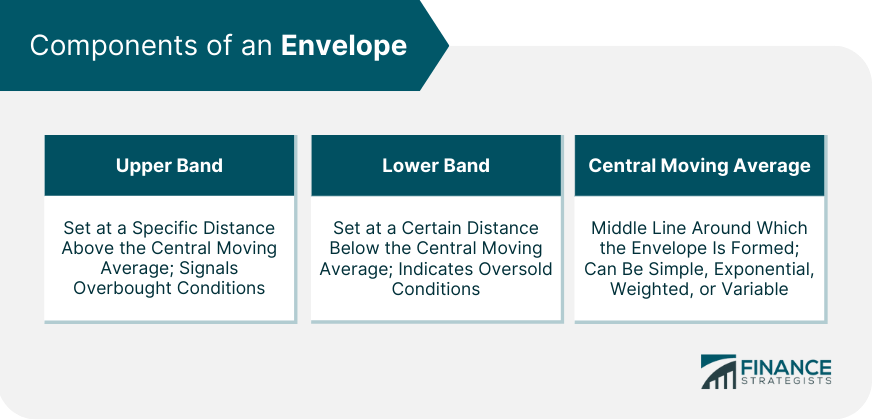
Components of an Envelope
Upper Band
Lower Band
Central Moving Average
Understanding the Envelope Indicator
Calculation and Formulation
Interpretation of Results
Types of Envelopes
Simple Moving Average (SMA) Envelope
Exponential Moving Average (EMA) Envelope
Weighted Moving Average (WMA) Envelope
Variable Moving Average (VMA) Envelope

The Role of Envelopes in Predicting Market Trends
Trend Identification
Detection of Overbought and Oversold Conditions
Indication of Volatility
The Envelope Strategy in Trading
When to Buy
When to Sell
Risk Management Considerations
Envelopes and Other Technical Analysis Tools
Integration With Volume Indicators
Combination With Momentum Oscillators
Correlation With Chart Patterns
Limitations and Pitfalls of Envelopes in Technical Analysis
False Signals and Noise
Dependence on Appropriate Parameter Selection
Limitations in Highly Volatile Markets
Final Thoughts
Envelope FAQs
The Envelope in technical analysis is used to identify the upper and lower limits of price fluctuations. It helps traders understand the trading range of a security, detect potential overbought or oversold conditions, and indicate changes in volatility.
While the Envelope can provide valuable insights, it is recommended to use it in conjunction with other technical analysis tools and indicators. Combining it with volume indicators, momentum oscillators, and chart patterns can enhance the accuracy of trading signals generated by the Envelope.
Yes, the Envelope can be applied to various types of securities, including stocks, commodities, currencies, and indices. It is a versatile tool that can be used in different markets and timeframes to analyze price movements and identify potential trading opportunities.
The Envelope is not without limitations. False signals due to market noise can occur, leading to potential trading losses. Additionally, the Envelope's effectiveness is highly dependent on appropriate parameter selection, such as the percentage for the bands and the type and length of the moving average. It can also be less effective in highly volatile markets where frequent breaches of the bands can occur.
Risk management is crucial when using the Envelope or any trading strategy. It is recommended to set stop-loss orders to limit potential losses if the price does not move as expected. Traders should also carefully monitor their trades and adjust their positions based on market conditions to mitigate risks and protect their capital.
True Tamplin is a published author, public speaker, CEO of UpDigital, and founder of Finance Strategists.
True is a Certified Educator in Personal Finance (CEPF®), author of The Handy Financial Ratios Guide, a member of the Society for Advancing Business Editing and Writing, contributes to his financial education site, Finance Strategists, and has spoken to various financial communities such as the CFA Institute, as well as university students like his Alma mater, Biola University, where he received a bachelor of science in business and data analytics.
To learn more about True, visit his personal website or view his author profiles on Amazon, Nasdaq and Forbes.


