
The Aroon Indicator is a technical analysis tool used to identify trends, assess their strength, and detect potential trend reversals in financial markets. It consists of two lines - the Aroon Up line and the Aroon Down line - that measure the time it takes for prices to reach their highest and lowest points over a specified period. The Aroon Indicator is widely used in wealth management as it provides valuable insights into market trends and helps investors make informed trading decisions. The Aroon Indicator holds significant importance in wealth management as it assists investors in understanding market trends and making timely investment decisions. By analyzing the Aroon Up and Aroon Down lines, wealth managers can assess the strength and direction of trends, identify potential reversals, and determine optimal entry and exit points. The Aroon Indicator provides valuable information for portfolio managers and traders, helping them navigate various market conditions and optimize their investment strategies. By incorporating the Aroon Indicator into their analysis, wealth managers can gain a competitive edge in identifying trend opportunities, managing risk, and enhancing overall portfolio performance. The Aroon Indicator consists of two lines - the Aroon Up line and the Aroon Down line. The Aroon Up line measures the number of periods since the highest high within a specified time period, while the Aroon Down line measures the number of periods since the lowest low. These lines oscillate between 0 and 100, with higher values indicating stronger trends. By comparing the values of the Aroon Up and Aroon Down lines, investors can assess the strength and direction of a trend. When the Aroon Up line is above the Aroon Down line, it indicates a bullish trend, suggesting that new highs are being reached more frequently than new lows. Conversely, when the Aroon Down line is above the Aroon Up line, it signals a bearish trend, indicating that new lows are being reached more frequently. The Aroon Indicator is valuable in detecting potential trend reversals. When the Aroon Up line crosses above the Aroon Down line, it may indicate a shift from a bearish to a bullish trend, suggesting a potential buying opportunity. Conversely, when the Aroon Down line crosses above the Aroon Up line, it may signal a shift from a bullish to a bearish trend, indicating a potential selling opportunity. The time periods used in calculating the Aroon Indicator can influence its sensitivity and the signals generated. Shorter time periods provide more responsive and frequent signals, but they may also be more prone to false signals. Longer time periods, on the other hand, generate signals less frequently but tend to be more reliable. It is important for investors to select appropriate time periods based on the specific market and trading strategy to achieve optimal results. One of the primary applications of the Aroon Indicator is to assess the strength of a trend. By analyzing the values of the Aroon Up and Aroon Down lines, investors can determine whether a trend is strong or weak. Higher Aroon Up values indicate a stronger bullish trend, while higher Aroon Down values indicate a stronger bearish trend. This information helps investors gauge the conviction behind market movements and make appropriate investment decisions. The Aroon Indicator is also effective in identifying potential trend reversals. When the Aroon Up line crosses above the Aroon Down line, it may signal a shift from a bearish to a bullish trend, indicating a potential buying opportunity. Conversely, when the Aroon Down line crosses above the Aroon Up line, it may suggest a shift from a bullish to a bearish trend, indicating a potential selling opportunity. By detecting trend reversals early, investors can take advantage of market turning points and adjust their positions accordingly. The Aroon Indicator helps investors determine optimal entry and exit points. By analyzing the Aroon lines and their crossovers, investors can identify potential buying or selling opportunities. For example, a crossover of the Aroon Up line above the Aroon Down line may suggest a bullish signal and an opportune moment to enter a long position. Conversely, a crossover of the Aroon Down line above the Aroon Up line may indicate a bearish signal and a suitable time to exit or consider shorting a position. Timing entry and exit points with the Aroon Indicator can enhance trading performance and improve overall profitability. In addition to identifying trends, the Aroon Indicator can help investors recognize range-bound markets. When both the Aroon Up and Aroon Down lines are near 50, it indicates a lack of clear trend direction. This suggests that the market is in a consolidation phase, moving within a defined range. Identifying range-bound markets can be advantageous for investors who employ specific strategies tailored to sideways price movements, such as mean reversion strategies or options selling strategies. The Aroon Indicator enhances trend analysis by providing valuable insights into the strength and direction of trends. It allows investors to identify whether a trend is strong or weak, helping them make informed decisions regarding trade entries, exits, and position adjustments. By incorporating the Aroon Indicator into their analysis, investors can gain a deeper understanding of market dynamics and improve their ability to navigate trends effectively. The Aroon Indicator aids in the timing of trades by identifying potential entry and exit points. By monitoring the crossovers and movements of the Aroon lines, investors can pinpoint favorable moments to enter or exit positions. This improves trade execution and increases the likelihood of capturing profitable opportunities. The Aroon Indicator's ability to detect trend reversals and provide timely signals assists investors in maximizing their trading performance. By utilizing the Aroon Indicator, investors can potentially achieve higher profits. The indicator helps identify strong trends and trend reversals, enabling investors to capitalize on market movements and position themselves advantageously. By entering trades at optimal moments and staying aligned with the prevailing trend, investors can increase their chances of generating higher returns and maximizing their profitability. The Aroon Indicator provides investors with increased confidence in their investment decisions. By utilizing a reliable and widely used technical analysis tool, investors can gain a sense of reassurance and conviction in their trading strategies. The Aroon Indicator's ability to identify trends, reversals, and potential entry/exit points supports investors in making well-informed decisions, reducing uncertainty, and enhancing their overall confidence in the investment process. One limitation of the Aroon Indicator is the potential for delayed signals. As the Aroon lines are based on historical price data, there is inherent lag in the indicator. It may take some time for the Aroon lines to reflect changes in market trends or reversals. This delay can result in missed opportunities or late entries and exits. Investors should be aware of this limitation and consider using the Aroon Indicator in conjunction with other technical analysis tools to confirm signals and reduce the impact of delayed information. In volatile market conditions, the Aroon Indicator may generate whipsaw signals. Whipsawing refers to frequent and rapid changes in trend signals without a sustained price movement. This can lead to false signals and potentially result in losses or ineffective trade execution. To mitigate the impact of whipsawing, investors may need to adjust the time periods used in the Aroon Indicator or incorporate additional filters to confirm signals. The Aroon Indicator's sensitivity to the chosen time periods can impact its effectiveness. Shorter time periods result in more sensitive and frequent signals, but they may also be more prone to noise and false signals. Longer time periods provide smoother signals, but they may generate fewer opportunities for timely entries and exits. Investors should carefully select appropriate time periods based on the market being analyzed and the desired trading strategy. The Aroon Indicator relies solely on historical price data to generate signals and assess trends. It does not take into account other fundamental or macroeconomic factors that may influence market movements. Investors should use the Aroon Indicator as one tool among many in their analysis and consider incorporating fundamental analysis, market news, and other relevant information to make well-rounded investment decisions. One strategy for utilizing the Aroon Indicator is the cross-over strategy. It involves monitoring the crossovers of the Aroon Up and Aroon Down lines. When the Aroon Up line crosses above the Aroon Down line, it may signal a bullish trend and a potential buying opportunity. Conversely, when the Aroon Down line crosses above the Aroon Up line, it may suggest a bearish trend and a potential selling opportunity. Traders can use these cross-overs as triggers to enter or exit positions. However, it is important to confirm signals with additional analysis or indicators to avoid false signals or whipsawing in volatile markets. Another strategy is the breakout strategy, which focuses on detecting potential breakouts from range-bound markets. Traders can monitor the Aroon Indicator for situations where both the Aroon Up and Aroon Down lines have been near 50 for an extended period, indicating a lack of clear trend direction. A breakout occurs when one of the Aroon lines breaks out of the consolidation range, suggesting a new trend may be forming. Traders can take positions when the breakout occurs and the Aroon lines confirm the new trend direction. This strategy allows traders to capture potential price movements as the market transitions from a range-bound state to a trending state. The divergence strategy involves identifying divergences between the Aroon Indicator and price action. Divergence occurs when the Aroon lines move in the opposite direction of price movements. For example, if prices make higher highs, but the Aroon Up line fails to make higher highs, it may suggest weakening bullish momentum. Traders can use these divergences as early warning signals for potential trend reversals or weakening trends. It can be combined with other technical analysis tools, such as oscillators or support/resistance levels, to confirm signals and make trading decisions. The Aroon Indicator is a powerful tool in wealth management that helps investors identify trends, assess trend strength, detect reversals, and time entry and exit points. It works by analyzing the Aroon Up and Aroon Down lines, which measure the time it takes for prices to reach their highest and lowest points over a specified period. By comparing the values and crossovers of these lines, investors can assess the strength and direction of trends and identify potential buying or selling opportunities. Incorporating the Aroon Indicator into investment decisions offers numerous benefits. It enhances trend analysis by providing insights into trend strength and reversals, allowing investors to make timely adjustments to their portfolios. The Aroon Indicator also improves the timing of trades, enabling investors to enter and exit positions at optimal moments. By utilizing this indicator, investors can potentially increase profitability and gain confidence in their investment decisions. The Aroon Indicator holds significant importance in wealth management as it provides valuable information for portfolio managers and traders. By effectively utilizing the Aroon Indicator, investors can navigate trends, manage risk, and improve overall portfolio performance. The ability to identify trends, assess their strength, and detect reversals is crucial for successful investment strategies, and the Aroon Indicator serves as a valuable tool in achieving these goals.What Is the Aroon Indicator?
How the Aroon Indicator Works
Identifying the Aroon Up and Aroon Down Lines
Assessing the Strength and Direction of a Trend
Detecting Trend Reversals and Potential Entry/Exit Points
Understanding the Impact of Time Periods on the Aroon Indicator
Applications of the Aroon Indicator
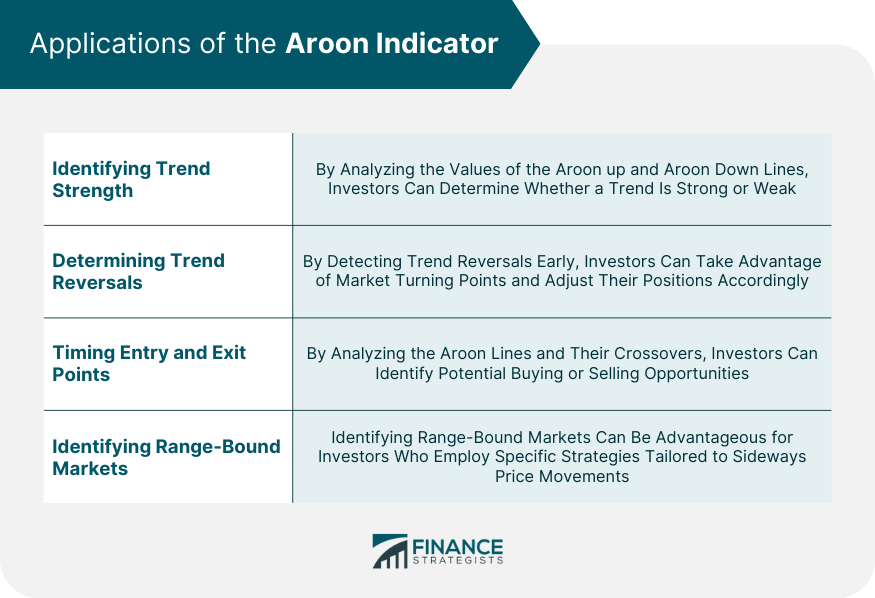
Identifying Trend Strength
Determining Trend Reversals
Timing Entry and Exit Points
Identifying Range-Bound Markets
Benefits of the Aroon Indicator
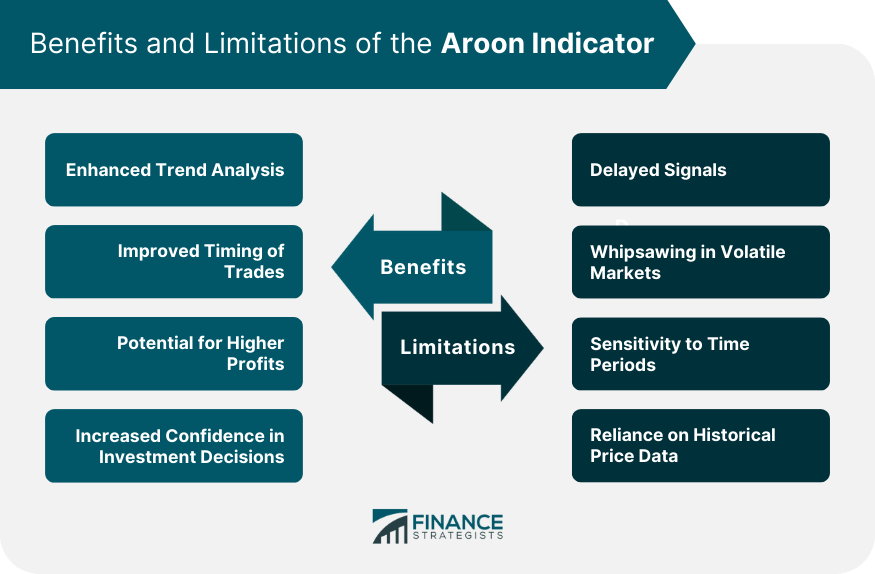
Enhanced Trend Analysis
Improved Timing of Trades
Potential for Higher Profits
Increased Confidence in Investment Decisions
Limitations of the Aroon Indicator
Delayed Signals
Whipsawing in Volatile Markets
Sensitivity to Time Periods
Reliance on Historical Price Data
Strategies for Using the Aroon Indicator
Cross-over Strategy
Breakout Strategy
Divergence Strategy
Bottom Line
Aroon Indicator FAQs
The Aroon Indicator is a technical analysis tool that measures the time it takes for prices to reach their highest and lowest points over a specified period. It consists of two lines - the Aroon Up line and the Aroon Down line - which help identify trends, assess trend strength, and detect potential reversals.
The Aroon Indicator works by comparing the values of the Aroon Up and Aroon Down lines. The Aroon Up line measures the time since the highest high, while the Aroon Down line measures the time since the lowest low. By analyzing the values and crossovers of these lines, investors can assess trend strength, detect reversals, and time their trades.
Incorporating the Aroon Indicator offers several benefits. It enhances trend analysis by providing insights into trend strength and reversals, improving the timing of trades. This can lead to better trade execution and increased profitability. Additionally, incorporating the Aroon Indicator can provide investors with confidence in their investment decisions and assist in optimizing portfolio performance.
The Aroon Indicator holds significant importance in wealth management as it provides valuable information for portfolio managers and traders. It aids in identifying trends, assessing their strength, and detecting potential reversals. By effectively utilizing the Aroon Indicator, investors can navigate trends, manage risk, and enhance overall portfolio performance.
No, the Aroon Indicator should not be the sole tool investors rely on. It is important to incorporate the Aroon Indicator into a comprehensive analysis that includes other technical and fundamental analysis tools. By considering multiple indicators and factors, investors can make well-informed investment decisions and reduce the potential for false signals or misinterpretations.
True Tamplin is a published author, public speaker, CEO of UpDigital, and founder of Finance Strategists.
True is a Certified Educator in Personal Finance (CEPF®), author of The Handy Financial Ratios Guide, a member of the Society for Advancing Business Editing and Writing, contributes to his financial education site, Finance Strategists, and has spoken to various financial communities such as the CFA Institute, as well as university students like his Alma mater, Biola University, where he received a bachelor of science in business and data analytics.
To learn more about True, visit his personal website or view his author profiles on Amazon, Nasdaq and Forbes.


