
An actuarial life table is a statistical tool used to analyze and quantify the probability of survival and death for a given population at different ages. It provides valuable insights into mortality patterns and helps insurance companies, pension plans, and other entities assess risks and make informed decisions. These tables are constructed based on extensive data collected from various sources, such as population censuses and mortality records. Actuarial life tables take into account factors like gender, age, and other demographic characteristics to generate accurate mortality rates and life expectancies. By using this information, actuaries can calculate premiums, determine appropriate pension payouts, and evaluate the financial viability of insurance and retirement plans. Life tables are essential in various fields, including insurance, pensions, public health, and demographic research. They are used to: Price life insurance products and annuities Estimate reserves for insurance companies Determine retirement benefits and funding requirements for pension plans Analyze mortality trends and evaluate health interventions Study population dynamics and compare different populations To understand actuarial life tables, it is crucial to become familiar with key terms and concepts: Age intervals: The age range within the life table is typically divided into single-year or five-year age groups. lx: The number of survivors at a given age. dx: The number of deaths between two consecutive age intervals. qx: The probability of dying within a specific age interval. px: The probability of surviving within a specific age interval. ex: The life expectancy at a given age, representing the average number of years an individual is expected to live from that age. The construction of actuarial life tables relies on data from various sources, including: 1. Population Censuses: These provide comprehensive demographic data on a country's population, including age, sex, and mortality rates. 2. Vital Statistics: These include birth and death records collected by government agencies, offering insights into mortality rates and population dynamics. 3. Surveys and Administrative Records: These sources, such as health surveys and social security records, can provide additional data on mortality patterns and population characteristics. Two critical demographic rates are used to construct life tables: 1. Age-Specific Mortality Rates: These are the number of deaths within an age interval divided by the average population in that interval. These rates help calculate the probability of dying (qx) and surviving (px) within specific age groups. 2. Age-Specific Survival Probabilities: These are calculated as the number of survivors at a given age divided by the initial population. These probabilities are essential for estimating life expectancy (ex) at different ages. Life tables can be organized into different types, depending on the data and purpose: 1. Cohort vs Period Life Tables: They track the mortality experience of a specific birth cohort (e.g., individuals born in a particular year), while period life tables use data from a specific time period to estimate the mortality patterns for a hypothetical cohort. 2. Complete vs Abridged Life Tables: Complete life tables include data for every single age, whereas abridged life tables present data for specific age intervals (e.g., five-year age groups). Life tables are organized by age intervals, typically ranging from single-year age groups to five-year age groups. Age intervals help actuaries and demographers study mortality patterns and calculate probabilities of dying and surviving within specific age ranges. The number of survivors (lx) represents the number of individuals in a hypothetical cohort still alive at a given age. This value is essential for calculating age-specific survival probabilities (px) and life expectancy (ex) within life tables. The number of deaths (dx) refers to the number of individuals who die within a specific age interval in a hypothetical cohort. This information is crucial for determining the probability of dying (qx) within certain age ranges and understanding the mortality patterns of a population. The probability of dying (qx) is the likelihood of an individual dying within a specific age interval. It is calculated by dividing the number of deaths (dx) within an age interval by the number of survivors (lx) at the beginning of the interval. This value is important for estimating mortality risks and setting insurance premiums. The probability of surviving (px) is the likelihood of an individual surviving through a specific age interval. It is calculated by subtracting the probability of dying (qx) from 1. This value plays a significant role in assessing survival probabilities and estimating life expectancy (ex) at various ages. Life expectancy (ex) is the average number of years an individual is expected to live at a given age. It is derived from the survival probabilities (px) and the number of survivors (lx) at different ages. Life expectancy is a crucial metric for understanding population health, planning retirement benefits, and pricing insurance products. Actuarial life tables are fundamental in the insurance industry for: 1. Pricing of Life Insurance Products: Insurers use life tables to estimate the probability of death at different ages, allowing them to set appropriate premiums and ensure financial solvency. 2. Estimation of Reserves: Insurance companies rely on life tables to calculate the reserves needed to cover future claims and maintain financial stability. Life tables play a vital role in pension plans by: 1. Determination of Retirement Benefits: Pension funds use life tables to estimate how long individuals will receive benefits, allowing them to determine the appropriate amount of benefits to be paid out. 2. Funding Requirements and Risk Assessments: Life tables help pension funds assess the risks associated with their obligations and determine the funding levels required to meet those obligations. In public health and epidemiology, life tables are used to: 1. Analyze Mortality Trends: Life tables help researchers understand patterns in mortality rates, enabling them to identify at-risk populations and study the impact of public health interventions. 2. Evaluation of Health Interventions: Life tables can be used to measure the effectiveness of healthcare interventions and policies by comparing changes in life expectancy and mortality patterns over time. Life tables are instrumental in demographic research, allowing researchers to: 1. Analyze Population Dynamics: Demographers use life tables to study changes in population size, age structure, and mortality patterns over time. 2. Comparison of Different Populations: Life tables enable comparisons between different populations, such as those from different countries or socioeconomic groups, to identify disparities and inform policy decisions. The accuracy of actuarial life tables depends on the quality and availability of demographic data. Incomplete, outdated, or inaccurate data can lead to errors in life tables, which may affect the reliability of mortality estimates and projections. Actuarial life tables rely on assumptions about future mortality trends, which may not always hold true. Changes in healthcare, technology, and social conditions can affect mortality patterns in ways that are difficult to predict, leading to potential inaccuracies in life tables. Mortality patterns can change over time due to factors such as advances in medical care, improvements in living conditions, and changes in lifestyle behaviors. These changes can impact the accuracy of life tables, necessitating regular updates and adjustments to account for evolving mortality trends. Life tables often assume homogeneity within a population, but this may not accurately reflect the diverse experiences of different subgroups. Factors such as socioeconomic status, race, and ethnicity can influence mortality patterns, and life tables that do not account for these differences may be less accurate in predicting mortality risks and life expectancy for specific population segments. Actuarial life tables are essential statistical tools used to analyze the probability of survival and death for a population at different ages. These tables are constructed using data from various sources and organized by age intervals, allowing for the calculation of key components such as probabilities of dying and surviving and life expectancy. With their widespread application in the insurance industry, pension planning, public health, and demographic research, actuarial life tables serve as a valuable resource for understanding and managing mortality risks. As you plan for your financial future, consider seeking retirement planning services to ensure that you have a comprehensive understanding of your longevity risks and the appropriate strategies in place to secure your financial well-being.What Is an Actuarial Life Table?
Purpose and Applications of Life Tables
Key Terminology and Concepts
Construction of Actuarial Life Tables
Data Sources and Collection Methods
Calculation of Demographic Rates
Organization of Life Table Data
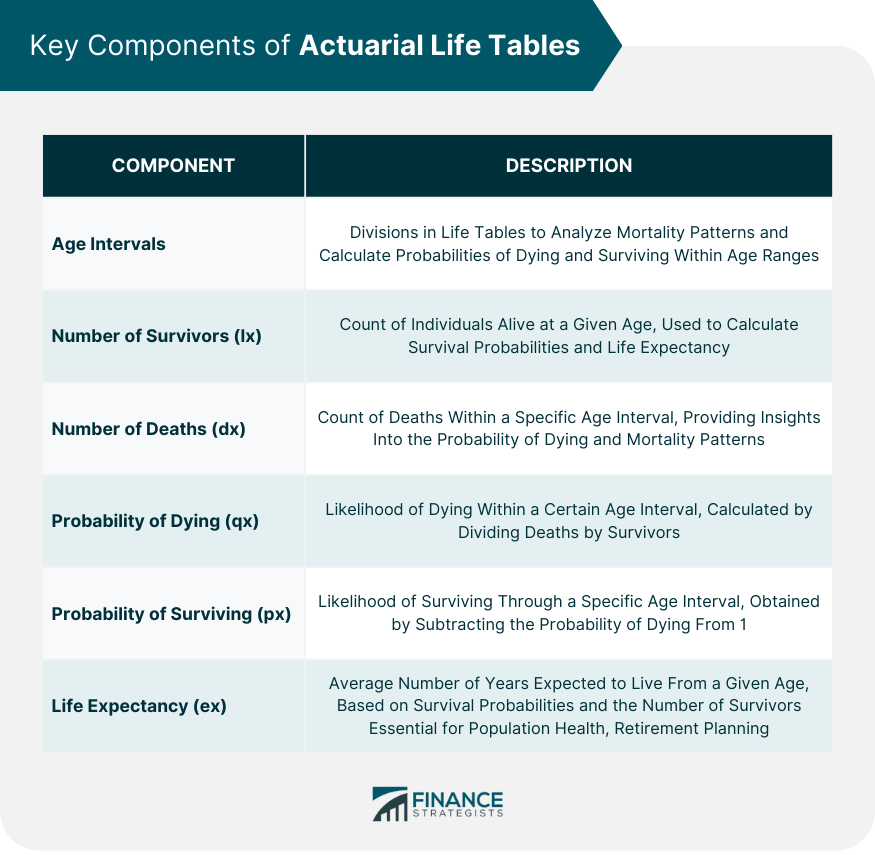
Key Components of Actuarial Life Tables
Age Intervals
Number of Survivors (lx)
Number of Deaths (dx)
Probability of Dying (qx)
Probability of Surviving (px)
Life Expectancy (ex)
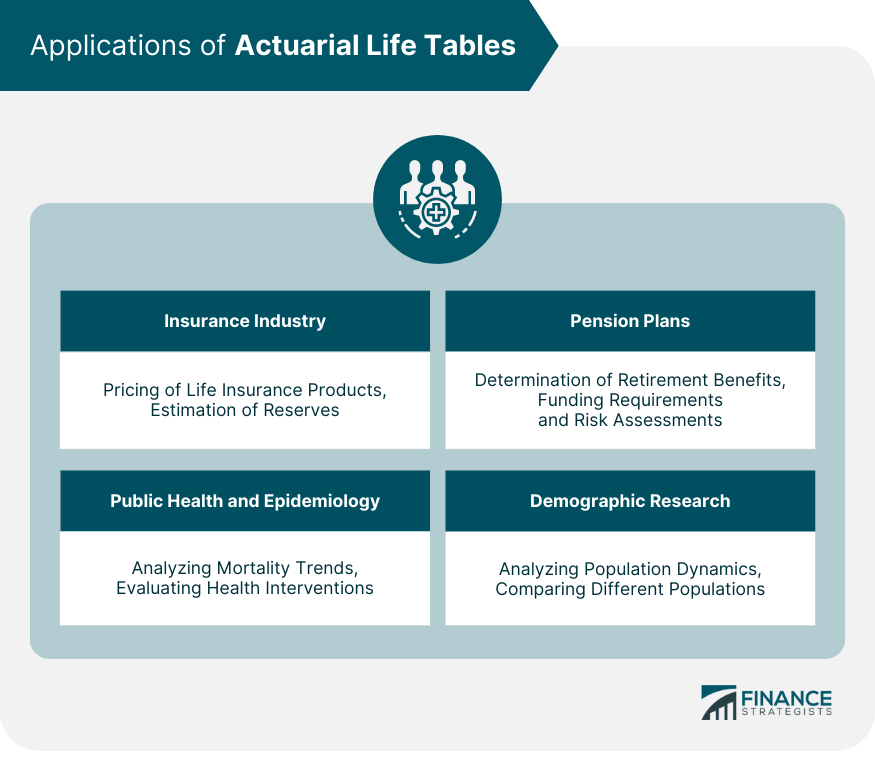
Applications of Actuarial Life Tables
Insurance Industry
Pension Plans
Public Health and Epidemiology
Demographic Research
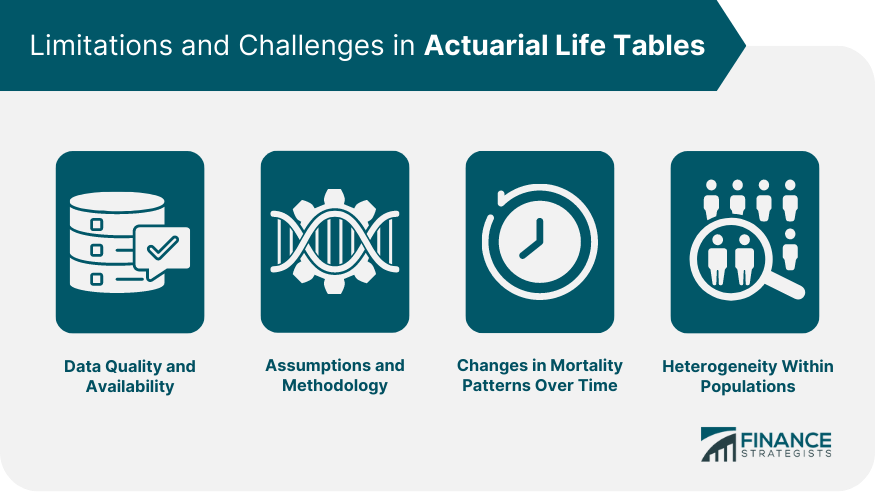
Limitations and Challenges in Actuarial Life Tables
Data Quality and Availability
Assumptions and Methodology
Changes in Mortality Patterns Over Time
Heterogeneity Within Populations
Final Thoughts
Actuarial Life Table FAQs
An actuarial life table is a statistical tool that quantifies the probability of survival and death for a population at different ages. It is commonly used in the insurance industry, pension planning, public health, and demographic research to assess mortality risks and make projections about future population trends.
An actuarial life table is constructed using data from various sources, such as population censuses, vital statistics, and surveys. Age-specific mortality rates and survival probabilities are calculated using this data, which is then organized by age intervals to form the life table.
The key components of an actuarial life table include age intervals, number of survivors (lx), number of deaths (dx), probability of dying (qx), probability of surviving (px), and life expectancy (ex). These components help actuaries and demographers study mortality patterns and calculate survival probabilities and life expectancies at different ages.
Actuarial life tables are important in retirement planning as they help estimate life expectancy and the probability of surviving to various ages. This information is crucial for determining how long an individual may need retirement income, assessing the sustainability of their retirement savings, and planning for potential long-term care needs.
Some limitations of actuarial life tables include data quality and availability, assumptions and methodology, changes in mortality patterns over time, and heterogeneity within populations. These factors may affect the accuracy and reliability of life table estimates, necessitating regular updates and adjustments to account for evolving trends and population dynamics.
True Tamplin is a published author, public speaker, CEO of UpDigital, and founder of Finance Strategists.
True is a Certified Educator in Personal Finance (CEPF®), author of The Handy Financial Ratios Guide, a member of the Society for Advancing Business Editing and Writing, contributes to his financial education site, Finance Strategists, and has spoken to various financial communities such as the CFA Institute, as well as university students like his Alma mater, Biola University, where he received a bachelor of science in business and data analytics.
To learn more about True, visit his personal website or view his author profiles on Amazon, Nasdaq and Forbes.


