
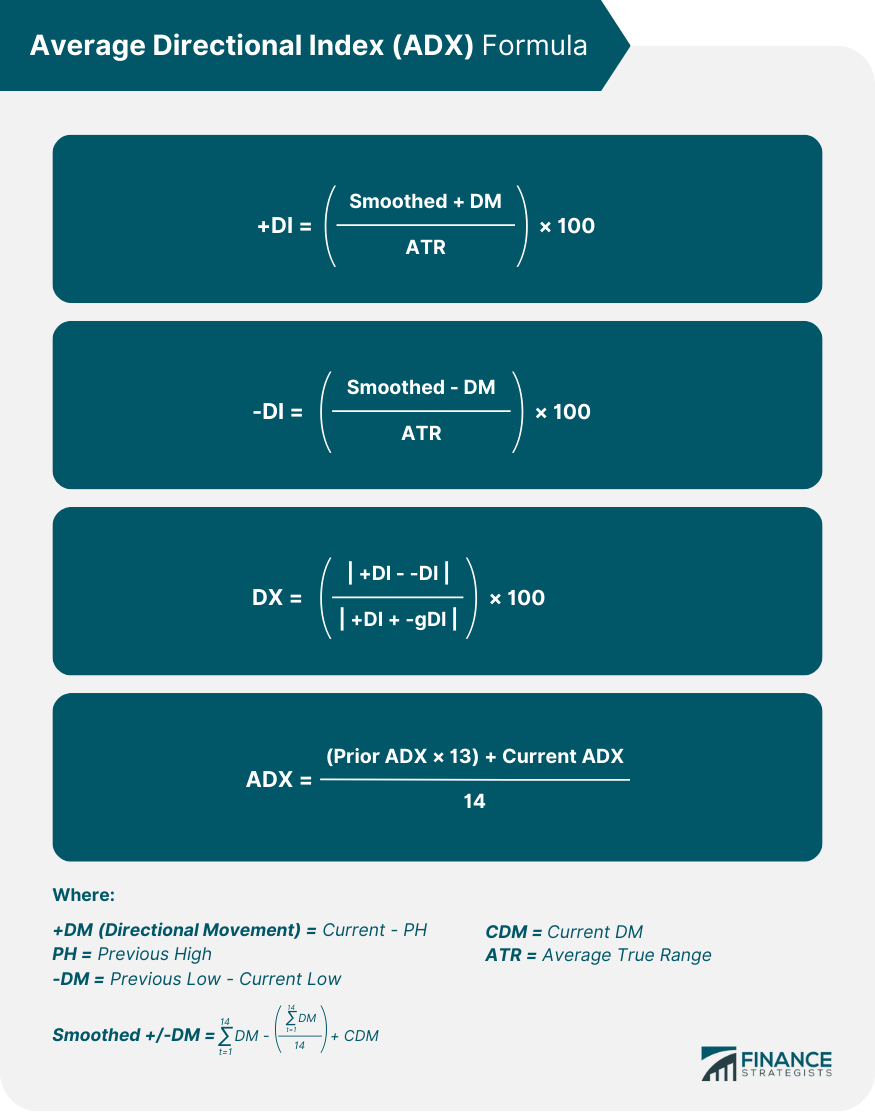
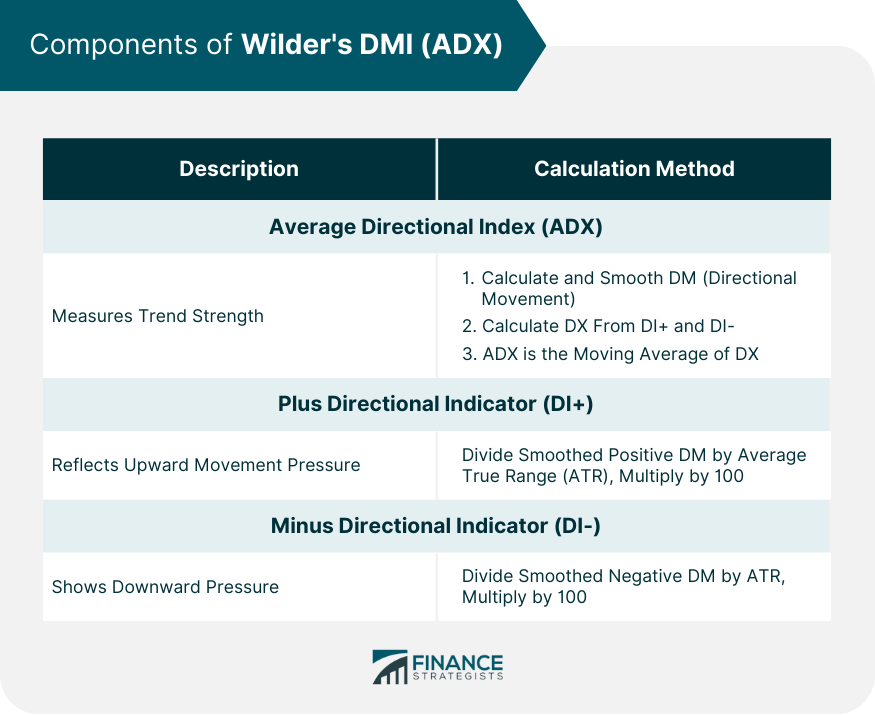
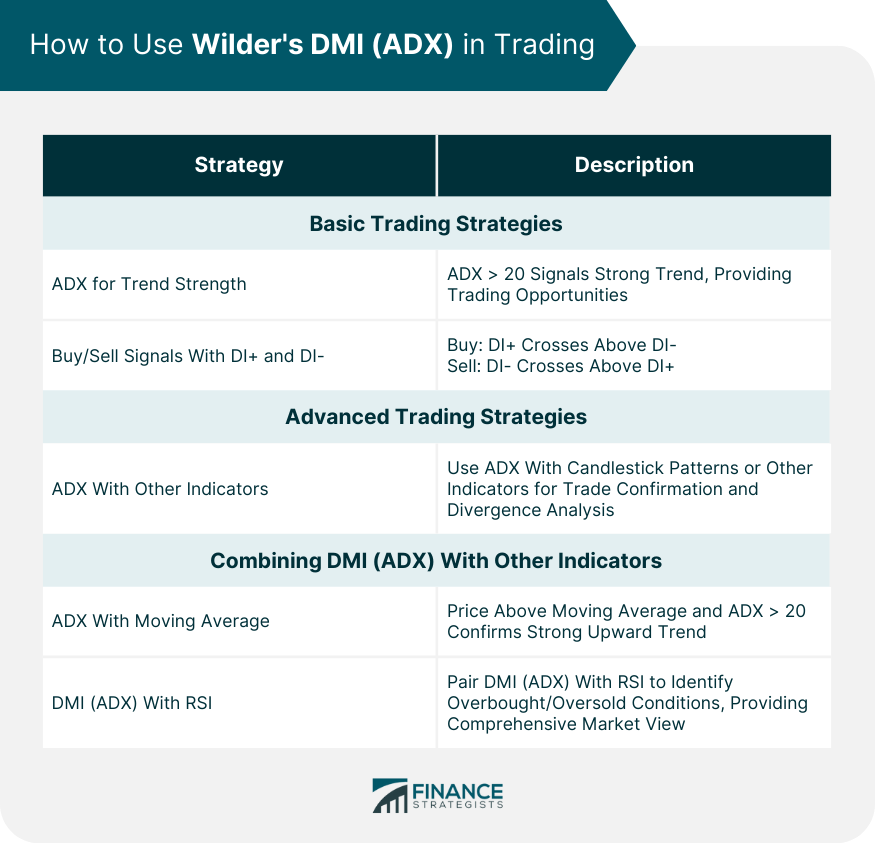
Wilder's DMI (ADX), a three-part indicator system, is a significant tool in technical analysis designed to evaluate both the strength and direction of market trends. Developed in the late 1970s by J. Welles Wilder Jr., a mechanical engineer, this innovative tool revolutionized market analysis with its nuanced approach. The Direction Movement Index (DMI) comprises three lines, namely ADX, DI+, and DI-, typically represented in black, green, and red, respectively, in most software defaults. The ADX line quantifies the strength of the trend, with higher values indicating a stronger trend. The Plus Direction Indicator (DI+) and Minus Direction Indicator (DI-), on the other hand, determine the current price direction. An ascending price momentum is signified when DI+ surpasses DI-, and a downward trajectory is indicated when DI- exceeds DI+. Wilder's revolutionary ADX contribution has significantly enhanced understanding of market trends, paving the way for more effective trading strategies. The calculation of the ADX involves several steps. First, the directional movement (DM) must be calculated. This is done by comparing the difference between the current high and the previous high (for positive DM) and the difference between the previous low and the current low (for negative DM). These values are then smoothed over a period, usually 14 days, to generate the smoothed Plus Directional Indicator (DI+) and Minus Directional Indicator (DI-). Once these values are calculated, the Directional Index (DX) is derived by taking the absolute value of the difference between DI+ and DI-, dividing it by their sum, and multiplying by 100 to get a percentage. The ADX is then the moving average of DX. The ADX level plays a critical role in understanding the trend's strength. An ADX value below 20 often indicates a weak trend or a ranging market, while a value above 20 suggests a strong trend. When the ADX line rises, it indicates that the trend is strengthening, and when it falls, the trend is weakening. The Plus Directional Indicator (DI+) is calculated by dividing the smoothed positive directional movement by the Average True Range (ATR), then multiplying by 100. This reflects the upward movement pressure in the market. DI+ gives traders insights into the upward direction of the market. When the DI+ line crosses above the DI- line, it generates a potential buy signal as the upward movement is prevailing. The Minus Directional Indicator (DI-) is calculated by dividing the smoothed negative directional movement by the Average True Range (ATR), then multiplying by 100. It shows the downward pressure in the market. DI- provides information on the market's downward movement. When the DI- line crosses above the DI+ line, it generates a potential sell signal as the downward trend is prevailing. The first strategy involves using the ADX to assess the trend's strength. Traders can look for opportunities when the ADX value is above 20, indicating a strong trend. This approach works well in trending markets, regardless of whether the trend is up or down. Buy and sell signals can be derived from the crossover points of the DI+ and DI- lines. When the DI+ line crosses above the DI- line, it's a signal to consider buying, as it indicates a strong upward trend. Conversely, when the DI- line crosses above the DI+ line, it might be time to sell or go short, as this suggests a strong downward trend. Advanced trading strategies using the DMI (ADX) involve further interpretation of the indicator's components and combining them with other technical analysis tools. For instance, traders can use ADX values in combination with candlestick patterns or other indicators to confirm potential trade entries or exits. Moreover, the ADX indicator can be used for divergence analysis. If the price is making higher highs, but the ADX is making lower highs, it could indicate a bearish divergence. Similarly, if the price is making lower lows, but the ADX is making higher lows, this could signal a bullish divergence. For better trading decisions, the DMI (ADX) can be paired with other technical indicators. For example, traders may use a moving average with the ADX to confirm the trend's direction. If the price is above the moving average and the ADX is above 20, this confirms a strong upward trend. Alternatively, the DMI (ADX) can be used with the RSI to identify overbought or oversold conditions. The combination of these indicators can provide a comprehensive view of market conditions, increasing the likelihood of successful trades. Like any technical indicator, the DMI (ADX) is not infallible and has its limitations. One of the primary limitations is that the ADX measures the strength of a trend but not its direction. While the DI+ and DI- provide directional cues, they may lag the price action, leading to potential delays in entry or exit points. Another limitation is that the DMI (ADX) performs best in trending markets. In a sideways or ranging market, the DMI (ADX) may produce many false signals, leading traders to enter or exit trades prematurely. Traders can misinterpret signals or experience false signals from the DMI (ADX) for several reasons. For instance, a common mistake is to assume that a high ADX reading indicates a strong upward trend, while in reality, it merely signifies a strong trend, either up or down. Additionally, it's important to remember that the ADX is a lagging indicator, which means it's based on past price movements. As a result, it can sometimes give false signals about the strength of a current trend. Despite the limitations and potential for misinterpretation, there are ways to mitigate the risks when using DMI (ADX). Combining it with other technical indicators can help confirm signals and reduce false alarms. Traders should also employ sound money management strategies, such as setting stop-loss orders and risking only a small percentage of their trading capital on any single trade. Wilder's Directional Movement Index (DMI), paired with the Average Directional Index (ADX), provides a robust tool for discerning the strength and direction of market trends. The DMI (ADX) is composed of three elements - the ADX, DI+, and DI-. The ADX quantifies the trend's strength, whereas DI+ and DI- indicate its direction. Despite its value, the DMI (ADX) has limitations. It only gauges trend strength without directional information and may provide delayed or false signals in certain market conditions. Therefore, combining DMI (ADX) with other technical indicators enhances market analysis, and implementing risk management techniques can offset trading risks. Leveraging DMI (ADX) to its full potential requires deep market knowledge and technical analysis skills. Enlisting professional wealth management services can further optimize trading performance and financial growth, allowing for the effective utilization of tools like DMI (ADX) and boosting confidence and success in navigating the markets.What Is Wilder's DMI (ADX)?
Understanding the Components of ADX
Average Directional Index
Calculation Method
Significance of Different ADX Levels
Plus Directional Indicator (DI+)
Calculation Method
Understanding the Signals of DI+
Minus Directional Indicator (DI-)
Calculation Method
Understanding the Signals of DI-
How to Use ADX in Trading
Basic Trading Strategies With DMI (ADX)
Utilizing ADX to Gauge Trend Strength
Understanding Buy and Sell Signals With DI+ and DI-
Advanced Trading Strategies With DMI (ADX)
Combining DMI (ADX) With Other Indicators for Confirmation
Limitations and Risks of Using ADX
Inherent Limitations of DMI (ADX)
Potential Misinterpretations and False Signals
How to Mitigate Risks When Using DMI (ADX)
Final Thoughts
Wilder's DMI (ADX) FAQs
Wilder's DMI (ADX) is a technical indicator that measures the strength and direction of a market trend. It is comprised of three lines: the ADX, which represents trend strength, and the DI+ and DI-, which indicate trend direction.
The DMI (ADX) is calculated using a series of mathematical formulas that measure the differences between the highs and lows of consecutive price bars. These differences are then smoothed and used to calculate the DI+ and DI-, and ADX.
A rising ADX in the DMI (ADX) generally signifies a strengthening trend, regardless of whether the trend is upwards or downwards.
Traders often use the DMI (ADX) to identify strong trends and determine potential entry and exit points. The crossovers of the DI+ and DI- lines can signal potential buy or sell opportunities.
The DMI (ADX) is a lagging indicator, meaning it can sometimes provide delayed signals. Also, it measures trend strength but does not indicate its direction. In sideways markets, it may provide false signals.
True Tamplin is a published author, public speaker, CEO of UpDigital, and founder of Finance Strategists.
True is a Certified Educator in Personal Finance (CEPF®), author of The Handy Financial Ratios Guide, a member of the Society for Advancing Business Editing and Writing, contributes to his financial education site, Finance Strategists, and has spoken to various financial communities such as the CFA Institute, as well as university students like his Alma mater, Biola University, where he received a bachelor of science in business and data analytics.
To learn more about True, visit his personal website or view his author profiles on Amazon, Nasdaq and Forbes.


