
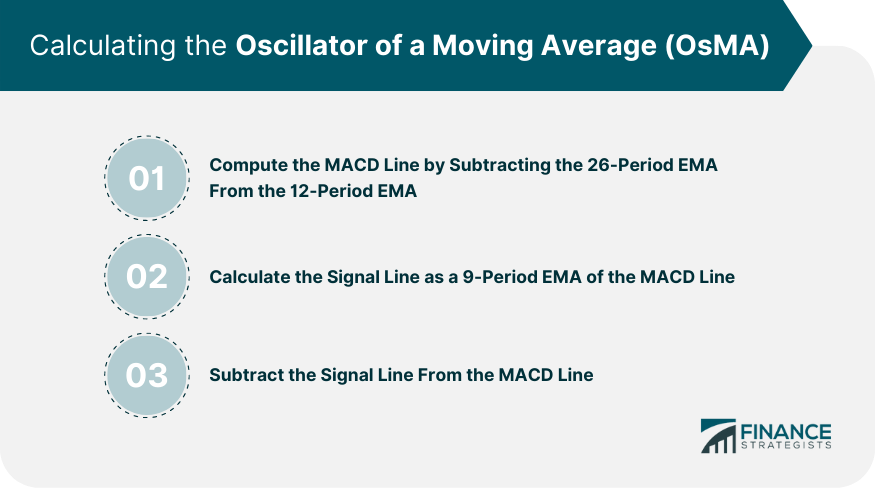
The Oscillator of a Moving Average is a technical analysis tool that traders and analysts use to confirm trends or anticipate reversals. The OsMA is essentially the difference between an oscillator and its smoothed version, with the most common being the difference between the Moving Average Convergence/Divergence (MACD) line and its signal line. The OsMA plays a significant role in technical analysis as it helps validate trend signals produced by other indicators, improving the accuracy of buy or sell decisions. The OsMA can enhance trading strategies by identifying market divergences, suggesting potential price reversals, and confirming bullish or bearish market conditions. The fundamental components of the OsMA are the MACD line and the signal line. The MACD line is the difference between two exponential moving averages (EMAs), typically the 12-period EMA and the 26-period EMA. The signal line is a smoothed version of the MACD line, often calculated as a 9-period EMA of the MACD line. The calculation of OsMA involves three steps. First, compute the MACD line by subtracting the 26-period EMA from the 12-period EMA. Second, calculate the signal line as a 9-period EMA of the MACD line. Finally, subtract the signal line from the MACD line to get the OsMA. The resulting value, plotted as a histogram, oscillates above and below a zero line. Bullish and bearish divergences are key signals provided by the OsMA. A bullish divergence occurs when the price of a security is making lower lows, but the OsMA is making higher lows. This could suggest a potential price reversal to the upside. Conversely, a bearish divergence happens when the price is making higher highs, but the OsMA is making lower highs, indicating a potential price reversal to the downside. Signal line crossovers are another important OsMA signal. When the OsMA crosses above the zero line, it suggests bullish momentum and could be a buy signal. On the other hand, when the OsMA crosses below the zero line, it indicates bearish momentum and could be a sell signal. Traders usually combine these signals with other technical indicators to reduce false alarms and improve trading accuracy. OsMA can be used in various trading strategies to identify potential buy or sell opportunities and validate trading signals produced by other technical analysis tools. When the OsMA is above zero in an uptrend or below zero in a downtrend, it confirms the trend direction. Traders might buy in an uptrend or sell in a downtrend when the OsMA validates the trend. Traders might consider buying when the price is in a long-term uptrend but the short-term OsMA is below zero, indicating a temporary pullback. Similarly, they might consider selling when the price is in a long-term downtrend but the short-term OsMA is above zero, suggesting a temporary bounce. A bullish breakout might be confirmed when the price breaks above resistance, and the OsMA is above zero. A bearish breakout might be confirmed when the price breaks below support, and the OsMA is below zero. Traders might consider buying when a bullish divergence occurs and selling when a bearish divergence occurs. They could set their stop-loss orders below the recent lows for bullish divergences or above the recent highs for bearish divergences. The indicator provides easy-to-understand signals that can be interpreted by traders of all experience levels. It offers clear buy and sell signals, making it a valuable tool for decision-making. For instance, when the OsMA is above zero during an uptrend or below zero during a downtrend, it can provide traders with a confirmation of the current trend, adding confidence to their trades. OsMA is particularly useful for identifying divergences between price and momentum. This can often signal potential reversals in the market, giving traders early warnings about possible changes in trend direction. The OsMA can also be useful for pointing out overbought or oversold conditions in the market. While these conditions can last for some time in strong trends, they can often precede reversals, giving traders an opportunity to position themselves accordingly. The OsMA is a versatile indicator that can be used in various market conditions and trading strategies. Whether in trend-following, mean-reversion, or breakout strategies, the OsMA can provide valuable insights. OsMA can help confirm signals from other technical analysis tools. This can help traders filter out false signals and increase the accuracy of their trading strategies. In trending markets, OsMA can often anticipate a trend continuation before the price resumes its direction, providing traders with an early entry opportunity. During periods of low volatility or when the market lacks a clear trend, OsMA might produce false signals. In these cases, the OsMA might oscillate around the zero line without providing clear buy or sell signals. Traders acting on these signals might incur losses. Like other oscillators, OsMA can remain in overbought or oversold territory for extended periods during strong trends. Traders who act on these signals alone could risk entering or exiting trades prematurely. While divergences between price and the OsMA can often indicate potential reversals, they are not always reliable. Sometimes, a divergence might occur, but the price could continue trending in the same direction, resulting in potential losses for traders who acted on the divergence signal. OsMA, like all other technical indicators, should not be used as a standalone tool for trading decisions. It works best when used in conjunction with other technical analysis tools and indicators. Relying solely on OsMA could lead to misinterpretation of market signals. As OsMA is a derivative of a moving average, it's a lagging indicator. It means that OsMA tends to react to price changes rather than predict them, potentially providing delayed entry or exit signals. Like all technical analysis tools, OsMA doesn't guarantee profits. It's a tool to aid decision-making, not a foolproof system. Traders should use it in conjunction with other tools, manage their risk, and develop a comprehensive trading plan. The Oscillator of a Moving Average is a valuable technical analysis tool that traders can use to confirm trends, anticipate reversals, and validate trading signals. By calculating the difference between an oscillator and its smoothed version, such as the MACD line and its signal line, the OsMA provides insights into market dynamics. It helps traders identify bullish and bearish divergences, understand signal line crossovers, and apply it in various trading strategies. The OsMA offers simplicity, trend confirmation, and the ability to identify divergences and overbought/oversold conditions. It is a versatile indicator suitable for trend-following, mean-reversion, breakout, and divergence strategies. However, traders should be cautious of false signals during low volatility, the prolonged presence of overbought or oversold conditions, and potential unreliability of divergences. It is crucial to use the OsMA in conjunction with other technical analysis tools, as it is not a standalone solution and may lag in providing entry or exit signals. Traders must understand that while the OsMA can assist in decision-making, there are no guarantees of profits, and it should be part of a comprehensive trading plan.What Is the Oscillator of a Moving Average (OsMA)?
Understanding the Calculation of OsMA
Fundamental Components
Process of Calculation
Interpreting OsMA Signals
Bullish and Bearish Divergences
Understanding Signal Line Crossovers
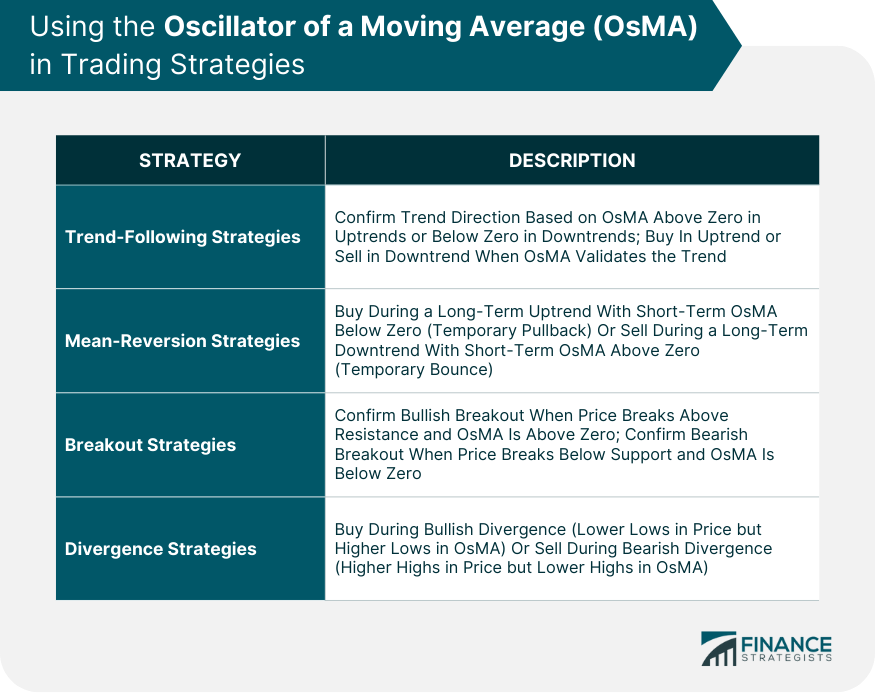
Using OsMA in Trading Strategies
Trend-Following Strategies
Mean-Reversion Strategies
Breakout Strategies
Divergence Strategies
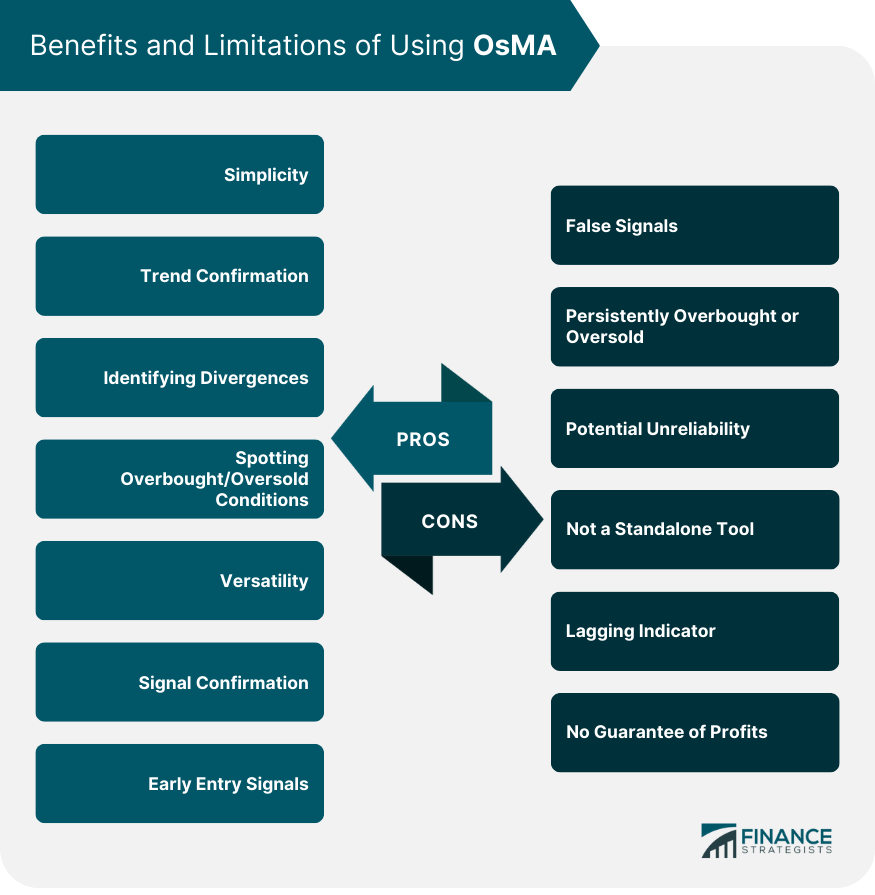
Benefits of Using OsMA
Simplicity
Trend Confirmation
Identifying Divergences
Spotting Overbought/Oversold Conditions
Versatility
Signal Confirmation
Early Entry Signals
Limitations and Cautions With OsMA
False Signals
Persistently Overbought or Oversold
Potential Unreliability
Not a Standalone Tool
Lagging Indicator
No Guarantee of Profits
Final Thoughts
Oscillator of a Moving Average (OsMA) FAQs
The OsMA is used in technical analysis to confirm trends, anticipate reversals, and validate trading signals. It helps traders make more informed decisions by calculating the difference between an oscillator and its smoothed version, providing insights into market dynamics.
The OsMA can be applied in various trading strategies, such as trend-following, mean-reversion, breakout, and divergence strategies. It helps identify potential buy or sell opportunities, confirms existing trends, and signals divergences between price and momentum.
The OsMA offers simplicity, trend confirmation, the ability to identify divergences and overbought/oversold conditions, and versatility in different market conditions and trading strategies. It can also help confirm signals from other technical analysis tools, provide early entry signals, and enhance decision-making accuracy.
Traders should be cautious of false signals during periods of low volatility, prolonged overbought or oversold conditions during strong trends, and potential unreliability of divergences. The OsMA should not be used as a standalone tool and should be combined with other indicators. Additionally, it is a lagging indicator that reacts to price changes rather than predicting them.
No, the OsMA, like any other technical analysis tool, does not guarantee profits. It is a tool to assist in decision-making and should be used in conjunction with proper risk management, a comprehensive trading plan, and consideration of other factors. Traders must understand that trading involves risks and no single indicator ensures consistent profitability.
True Tamplin is a published author, public speaker, CEO of UpDigital, and founder of Finance Strategists.
True is a Certified Educator in Personal Finance (CEPF®), author of The Handy Financial Ratios Guide, a member of the Society for Advancing Business Editing and Writing, contributes to his financial education site, Finance Strategists, and has spoken to various financial communities such as the CFA Institute, as well as university students like his Alma mater, Biola University, where he received a bachelor of science in business and data analytics.
To learn more about True, visit his personal website or view his author profiles on Amazon, Nasdaq and Forbes.


