
The neckline serves as a pivotal line formed by connecting the low points of two peaks in a double top or head and shoulders pattern, or the high points of two troughs in a double bottom or inverse head and shoulders pattern. The importance of the neckline lies in its function as a key support or resistance level. A break below this line is considered bearish, indicating potential further declines, while a break above is viewed as bullish, suggesting more gains to come. The neckline is a critical element in technical analysis. It helps traders identify chart patterns, determine potential breakout points, and establish strategic entry and exit points. Essentially, it assists traders in making informed decisions based on observable and repeatable price patterns. In terms of representation, the neckline appears in several key chart patterns in technical analysis. These include the head and shoulders, inverse head and shoulders, double top, and double bottom patterns. The neckline connects the reaction lows in a head and shoulders or double top pattern, and the reaction highs in an inverse head and shoulders or double bottom pattern. Neckline acts as a key indicator of potential trend reversals. A break of the neckline often signals a significant shift in the supply and demand balance for the asset, potentially indicating the start of a new trend. This makes the neckline a crucial tool for traders trying to anticipate and capitalize on significant price movements. A regular neckline, or horizontal neckline, is a type of neckline that forms a horizontal support or resistance line in a chart pattern. This type indicates a solid price level where the asset has repeatedly failed to move beyond, signaling a strong barrier for price movement. An inclined or ascending neckline is a type that slopes upward. This implies that the lows of the pattern are getting higher, potentially signifying increasing buying pressure. Despite this, a break below the inclined neckline could still suggest a bearish reversal. A declined or descending neckline, on the other hand, slopes downward. This suggests that the highs in the pattern are getting lower, indicating increasing selling pressure. Conversely, a break above a declined neckline could signal a bullish reversal. The head and shoulders pattern is a classic example of a chart pattern that involves the neckline. It consists of three peaks, with the middle peak (the head) being the highest and the two others (the shoulders) being lower. The neckline connects the lows after the first and second peaks. The inverse head and shoulders pattern is a bullish reversal pattern that also features a neckline. It’s essentially the head and shoulders pattern flipped upside down, with the neckline connecting the highs after the first and second troughs. Double top and double bottom patterns are two more examples that involve the neckline. In a double top pattern, the neckline connects the low after the first and second peaks. On the other hand, in a double bottom pattern, the neckline connects the high after the first and second troughs. A bullish neckline breakout occurs when the price of an asset moves above the neckline in a chart pattern. This can be a signal of a potential upward trend reversal, particularly in the case of an inverse head and shoulders or double bottom pattern. On the flip side, a bearish neckline breakout happens when the price of an asset breaks below the neckline. This could be a sign of a potential downward trend reversal, especially in the context of a head and shoulders or double top pattern. The neckline can help determine strategic trade entry points. For instance, traders might enter a long position when the price breaks above the neckline in an inverse head and shoulders or double bottom pattern, indicating a potential bullish reversal. The neckline can also assist in setting stop loss levels. Traders could set a stop loss just below the neckline in a potential bullish reversal, or just above the neckline in a potential bearish reversal, helping to limit potential losses if the trade does not go as planned. Lastly, the neckline can be useful in establishing profit targets. For example, traders could measure the vertical distance from the head to the neckline in a head and shoulders pattern and then subtract that distance from the point of breakout to get a profit target. One of the primary risks in trading using the neckline is the possibility of false breakouts and whipsaws. These occur when the price appears to break the neckline but then quickly reverses direction, potentially leading to losses. Another risk is related to timing and patience in trade execution. Given that neckline breakouts can signal major trend reversals, traders might be tempted to act prematurely before the breakout is confirmed. This could result in entering a trade too early or too late. It's important to note the significance of volume confirmation in neckline trading strategies. A breakout accompanied by high trading volume can often lend more credibility to the signal, while a breakout with low volume might be more prone to failure. Incorporating other technical indicators can enhance the effectiveness of neckline analysis. For instance, trend lines and moving averages can provide additional context for price trends, helping traders make more informed decisions. Volume and momentum indicators can also play a vital role. These tools can offer insights into the strength behind a price move, thereby enhancing the reliability of neckline breakout signals. The neckline is a fundamental concept in technical analysis that serves as a key support or resistance level and plays a crucial role in identifying chart patterns and predicting price movements. It helps traders make informed decisions by establishing strategic entry and exit points, as well as setting stop loss levels and profit targets. However, traders should be aware of the risks and limitations associated with neckline trading strategies, such as false breakouts and the importance of timing and volume confirmation. By combining neckline analysis with other technical indicators like trend lines, moving averages, volume, and momentum indicators, traders can enhance the effectiveness of their trading strategies and increase their chances of success in the market. Overall, understanding and utilizing the neckline can be a valuable tool for traders seeking to navigate the complexities of the financial markets.What Is the Neckline?
How the Neckline Works
Representation in Chart Patterns
Significance in Price Trends
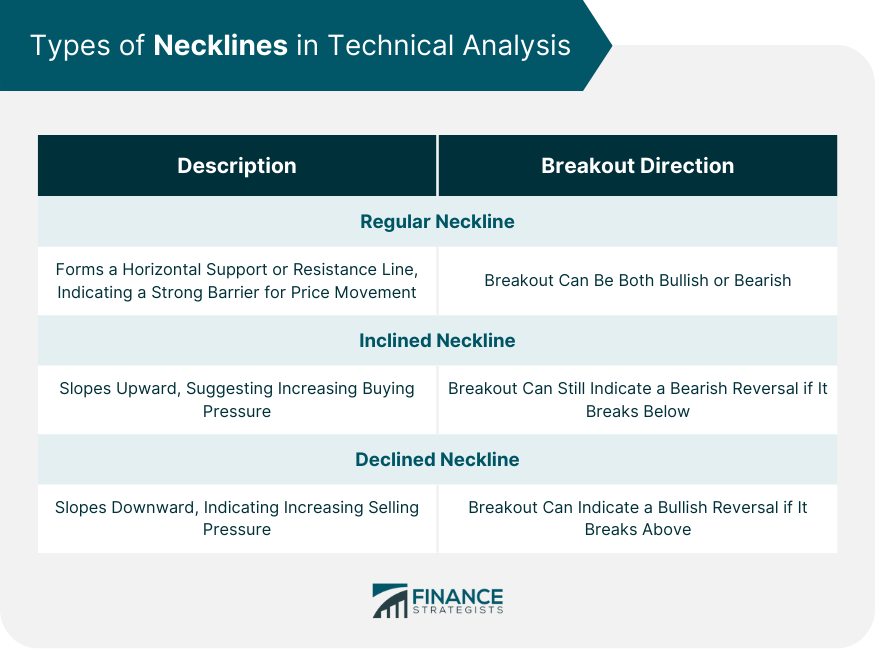
Types of Necklines in Technical Analysis
Regular Neckline
Inclined Neckline
Declined Neckline
Major Chart Patterns Involving Necklines
Head and Shoulders Pattern
Inverse Head and Shoulders Pattern
Double Top and Double Bottom Patterns
Interpreting Neckline Breakouts
Bullish Neckline Breakouts
Bearish Neckline Breakouts
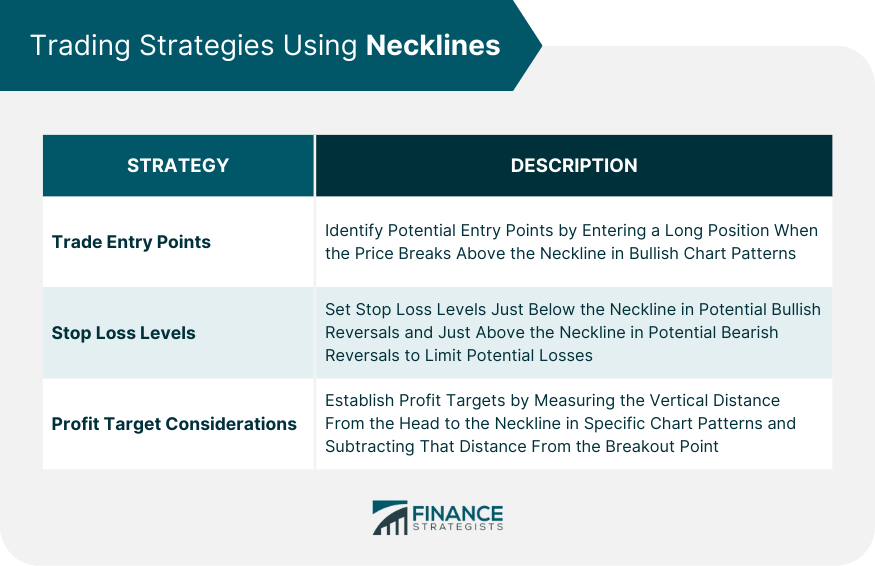
Trading Strategies Using Necklines
Trade Entry Points
Stop Loss Levels
Profit Target Considerations
Risks and Limitations of Neckline Trading Strategies
False Breakouts and Whipsaws
Timing and Patience in Trade Execution
Volume Confirmation
Combining Neckline Analysis With Other Technical Indicators
Trend Lines and Moving Averages
Volume and Momentum Indicators
Final Thoughts
Neckline FAQs
The neckline serves as a key support or resistance level in chart patterns. It helps traders identify potential trend reversals, establish entry and exit points, and make informed trading decisions based on observable price patterns.
A neckline breakout occurs when the price of an asset breaks either above or below the neckline. A bullish neckline breakout suggests a potential upward trend reversal, while a bearish neckline breakout indicates a potential downward trend reversal. Traders often look for confirmation of the breakout through factors like volume and momentum indicators.
One risk is the possibility of false breakouts and whipsaws, where the price initially breaks the neckline but quickly reverses direction. Timing and patience in trade execution are also important, as acting too early or too late can impact trade outcomes. Additionally, volume confirmation is crucial, as breakouts with low volume may be less reliable.
Trend lines and moving averages can provide additional context for price trends and support the analysis of neckline breakouts. Volume and momentum indicators can offer insights into the strength behind price movements, thereby enhancing the reliability of neckline signals.
Yes, the neckline is a common element in several chart patterns, including the head and shoulders, inverse head and shoulders, double top, and double bottom patterns. It connects specific points within these patterns and plays a significant role in determining potential trend reversals.
True Tamplin is a published author, public speaker, CEO of UpDigital, and founder of Finance Strategists.
True is a Certified Educator in Personal Finance (CEPF®), author of The Handy Financial Ratios Guide, a member of the Society for Advancing Business Editing and Writing, contributes to his financial education site, Finance Strategists, and has spoken to various financial communities such as the CFA Institute, as well as university students like his Alma mater, Biola University, where he received a bachelor of science in business and data analytics.
To learn more about True, visit his personal website or view his author profiles on Amazon, Nasdaq and Forbes.


