
Money Flow is a crucial concept in technical analysis used by traders to assess the strength of a trend by evaluating the volume of money flowing into and out of a security. The technique enables traders to determine whether a stock is being accumulated or distributed, providing a perspective that goes beyond mere price changes. Its importance in trading lies in the underlying assumption that high trading volume signifies strength behind a price move. If a stock's price increases during periods of heavy trading, it suggests strong buying pressure, signaling a possible uptrend. While both Money Flow and volume play pivotal roles in stock analysis, they provide different insights. Volume refers to the total number of shares traded during a particular period, regardless of the trading price. On the other hand, Money Flow considers both the volume of shares traded and the price at which they were traded, offering a more comprehensive perspective on market sentiment. The interaction between price and volume underpins the Money Flow concept. When a security is traded, the volume multiplies by the transaction price to calculate the total Money Flow for that period. This figure provides a more nuanced understanding of market activity than volume alone, factoring in the strength of buyer or seller sentiment. Positive Money Flow is the situation where the typical price of a security on a given day exceeds that of the previous day, which suggests strong buying pressure. On the other hand, Negative Money Flow transpires when the typical price of a security declines compared to the previous day, implying a robust selling pressure. The significance of Money Flow in the stock market lies in its ability to provide investors with a deeper understanding of market sentiment and trend strength. It can help traders determine whether a current trend is likely to continue or reverse, offering valuable insights for making informed investment decisions. The Money Flow Index is a momentum indicator that utilizes both price and volume data to identify overbought or oversold conditions in a market. It operates on a scale of 0 to 100, with readings above 80 indicating overbought conditions and readings below 20 signaling oversold conditions. Reading the MFI requires understanding its oscillating nature. When the MFI rises above 80, a price correction may be imminent. Conversely, when the MFI falls below 20, a price bounce could be on the horizon. The Chaikin Money Flow is a volume-weighted average of accumulation and distribution over a specified period. Developed by Marc Chaikin, the CMF fluctuates between -1 and 1, with positive values indicating buying pressure and negative values indicating selling pressure. It is often used in conjunction with other indicators to confirm trend strength. The interpretation of the CMF centers around its zero line. A positive CMF value, particularly one that remains positive over time, signals a strong buying pressure. On the other hand, a negative CMF value denotes selling pressure. Moreover, divergences between the CMF and the underlying security's price can also indicate potential reversals, offering traders additional insights. Money Flow Volume is an aspect of the Money Flow Index that integrates price and volume to measure buying and selling pressure. MFV is essentially a running total of Money Flow, cumulatively adding positive Money Flow and subtracting negative Money Flow over time. This resultant figure reflects the balance between buying and selling pressure. An increasing MFV typically suggests that buying pressure is outweighing selling pressure, which could indicate an upward price trend. Conversely, a decreasing MFV may imply that selling pressure is dominating, potentially signaling a downward price trend. Perhaps the most significant benefit of Money Flow analysis is the insight it provides into market activity. By considering both price and volume data, it offers a more holistic view than just looking at the price alone. This can help traders identify times when there is strong buying or selling pressure, which can signal potential changes in price trends. Money Flow analysis can also be used to identify potential market reversals. If there is a divergence between the Money Flow Index and the price trend – for example, if prices are rising but the MFI is falling – this could indicate that the trend is losing strength and may be about to reverse. This information can be invaluable for traders looking to enter or exit positions at optimal times. Similarly, Money Flow analysis can help confirm the strength of existing trends. If the MFI is moving in the same direction as the price, this indicates that the trend is strong and likely to continue. This can provide traders with added confidence in their trading decisions. The MFI, which is derived from Money Flow, is a bounded oscillator that moves between 0 and 100. As mentioned above, values of 80 or above are generally considered overbought, while values of 20 or below are considered oversold. These conditions can signal potential turning points in price trends, offering traders potential entry and exit points. By providing a deeper understanding of market dynamics, Money Flow analysis can lead to more informed trading decisions. Traders can use it to identify potentially profitable trading opportunities and to manage risk by highlighting when it may be prudent to exit a position. Like any technical analysis tool, Money Flow analysis is not immune to generating false signals. An indicator might suggest an overbought or oversold condition, but the price may not necessarily reverse. The market can stay overbought or oversold for extended periods. It's also possible for price and Money Flow divergences to resolve without a significant trend change. Money Flow indicators are often used in combination with other technical analysis tools for confirmation. If used in isolation, they can lead to misleading results. For instance, an overbought signal on the Money Flow Index might be a false alarm if not corroborated by other indicators or patterns. Money Flow indicators, like the MFI, are typically lagging indicators. They are most effective in trending markets and can be less useful during periods of sideways price action. Their predictive utility is limited as they are based on historical data, and all indicators based on past data can lag behind real-time market changes. For novice traders, understanding and correctly interpreting Money Flow analysis can be complex. It requires a solid grasp of both price and volume data, as well as knowledge of how various Money Flow indicators work. Money Flow analysis heavily relies on accurate volume data. However, in certain markets, such as forex, obtaining reliable volume information can be challenging, limiting the effectiveness of Money Flow analysis in these markets. Money Flow divergence occurs when there's a discrepancy between the direction of the Money Flow Index and the price trend of the security. This divergence can indicate a weakening trend and potential price reversal. To enhance the accuracy of their predictions, traders often use Money Flow analysis in conjunction with other technical analysis tools. These may include trend lines, moving averages, or momentum oscillators. This cross-verification process can help confirm trading signals and reduce the likelihood of false signals. In today's digital age, Money Flow analysis is also being incorporated into algorithmic trading systems. These automated systems can interpret Money Flow data and execute trades accordingly, reducing the need for manual intervention and allowing for high-speed trading. Money Flow is a valuable tool in technical analysis that provides traders with insights into market sentiment and trend strength. By considering both price and volume data, it offers a more comprehensive understanding of market activity and helps identify strong buying or selling pressure. However, it is important to acknowledge the drawbacks of Money Flow analysis, including the potential for false signals, the need for dependence on other indicators, the lagging nature of indicators, the complexity of interpretation, and the reliance on accurate volume data. Overall, Money Flow analysis serves as a valuable tool for traders seeking to make informed investment decisions and navigate the complexities of the stock market. By incorporating this concept into their trading strategies and complementing it with other technical analysis tools, traders can gain a deeper understanding of market dynamics and potentially improve their trading outcomes.What Is Money Flow?
How Money Flow Works
Components of Money Flow: Price and Volume
Concept of Positive and Negative Money Flow
Significance of Money Flow in the Stock Market
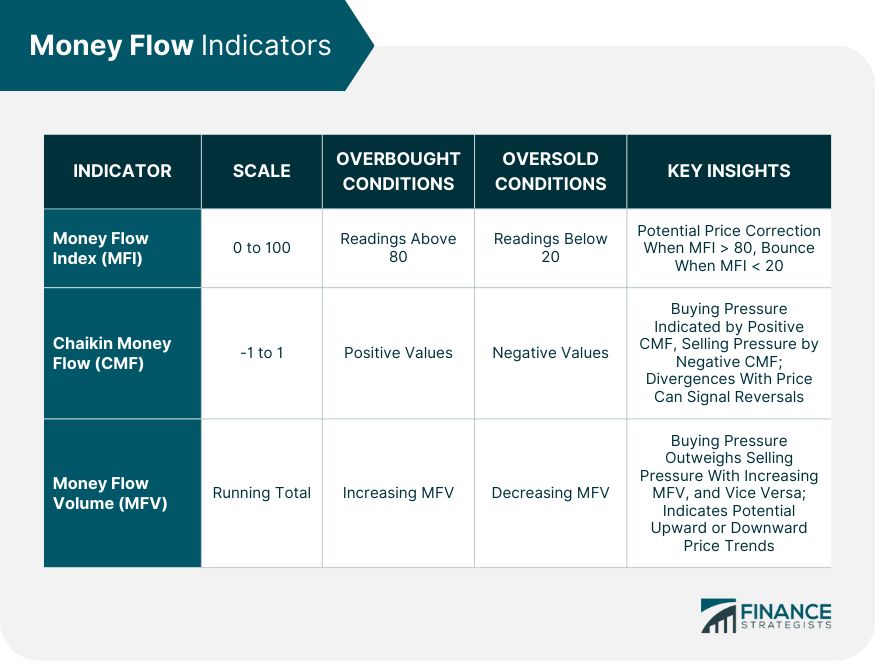
Money Flow Indicators
Money Flow Index (MFI)
Chaikin Money Flow (CMF)
Money Flow Volume (MFV)
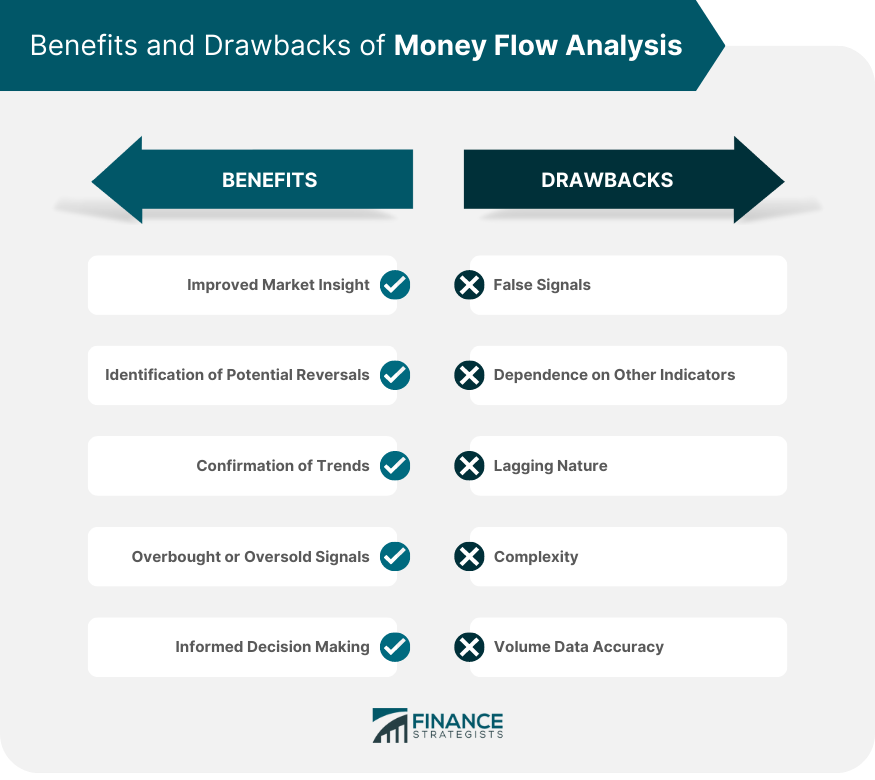
Benefits of Money Flow Analysis
Improved Market Insight
Identification of Potential Reversals
Confirmation of Trends
Overbought or Oversold Signals
Informed Decision-Making
Drawbacks of Money Flow Analysis
False Signals
Dependence on Other Indicators
Lagging Nature
Complexity
Volume Data Accuracy
Advanced Concepts in Money Flow Analysis
Money Flow Divergence
Cross-Verification With Other Technical Analysis Tools
Use of Money Flow in Algorithmic Trading
Final Thoughts
Money Flow FAQs
Volume refers to the total number of shares traded during a specific period, irrespective of the trading price. On the other hand, money flow considers both the volume of shares traded and the price at which they were traded. Money flow provides a more comprehensive perspective on market sentiment, as it evaluates the strength of buying or selling pressure behind a price move.
Money flow analysis offers insights into market sentiment and trend strength. It helps traders determine whether a current trend is likely to continue or reverse, providing valuable information for making informed investment decisions. By identifying times of strong buying or selling pressure, traders can assess potential changes in price trends and adjust their positions accordingly.
Two commonly used money flow indicators are the Money Flow Index (MFI) and the Chaikin Money Flow (CMF). The MFI combines price and volume data to identify overbought or oversold conditions, while the CMF is a volume-weighted average of accumulation and distribution. These indicators, along with others like Money Flow Volume (MFV), help traders gauge market activity and confirm trend strength.
Yes, like any technical analysis tool, money flow analysis can generate false signals. An indicator might suggest an overbought or oversold condition, but the price may not necessarily reverse. Markets can remain overbought or oversold for extended periods, and price and money flow divergences may resolve without significant trend changes. It is important to use money flow analysis in conjunction with other indicators and patterns for confirmation.
Money flow analysis heavily relies on accurate volume data, which can be a challenge to obtain in certain markets, such as forex. Therefore, the effectiveness of money flow analysis may vary across different markets. Traders should consider the availability and reliability of volume data before applying money flow analysis in their trading strategies.
True Tamplin is a published author, public speaker, CEO of UpDigital, and founder of Finance Strategists.
True is a Certified Educator in Personal Finance (CEPF®), author of The Handy Financial Ratios Guide, a member of the Society for Advancing Business Editing and Writing, contributes to his financial education site, Finance Strategists, and has spoken to various financial communities such as the CFA Institute, as well as university students like his Alma mater, Biola University, where he received a bachelor of science in business and data analytics.
To learn more about True, visit his personal website or view his author profiles on Amazon, Nasdaq and Forbes.


