
The Money Flow Index is a momentum indicator that quantifies the inflow and outflow of money into a security over a specific period. It is a type of oscillator that moves between zero and 100, providing insights into market sentiment and potential price reversals. Other crucial terms associated with MFI include 'Typical Price,' which is the average of high, low, and close prices, and 'Money Flow,' which is the product of typical price and volume. The Money Flow Index was developed by Gene Quong and Avrum Soudack, who sought to create an indicator that combines both price and volume data. Introduced in the late 20th century, the MFI quickly became a popular tool amongst technical traders for its ability to gauge buying and selling pressure in the markets. MFI is a volume-weighted version of the Relative Strength Index (RSI). It uses both price and volume data to identify overbought and oversold conditions in the financial market. By evaluating money flow, the MFI generates a value between 0 and 100. Generally, an MFI over 80 suggests an overbought condition (potential for a price fall), while an MFI below 20 indicates an oversold state (possible price rise). In the financial market, the MFI serves as a crucial tool for traders and investors. It helps gauge the strength of money flowing in and out of a security, signaling potential price reversals. Traders frequently use the MFI to validate signals from other technical analysis tools, improving the accuracy of their forecasts. Unlike other momentum indicators, such as the RSI, which consider only price movements, MFI incorporates volume, offering a more comprehensive market perspective. This incorporation of volume sets the MFI apart by providing insights into the force behind price moves. The calculation of the MFI involves several steps: 1. Compute the Typical Price: (High + Low + Close) / 3 2. Calculate the Raw Money Flow: Typical Price * Volume 3. Determine the Money Flow Ratio: (14-period Positive Money Flow) / (14-period Negative Money Flow) 4. Compute the Money Flow Index: 100 - 100/(1 + Money Flow Ratio) Assume a security with the following 14-day price data 1, 7 days with positive money flow (up days), where the typical price was higher than the previous day's, and the total positive money flow is $200,000 2. 7 days with negative money flow (down days), where the typical price was lower than the previous day's, and the total negative money flow is $100,000 The Money Flow Ratio would be (200,000 / 100,000) = 2 Hence, the MFI would be 100 - 100/(1+2) = 66.67 Most trading platforms and financial software have built-in MFI calculators. Traders only need to select the MFI indicator and choose their preferred period setting, most commonly 14 periods. Examples of such platforms include MetaTrader, TradingView, and Bloomberg Terminal. The MFI oscillates between 0 (oversold) and 100 (overbought). However, these extreme values are rare. Traders generally consider securities overbought when the MFI is above 80 and oversold when it's below 20. High MFI values (above 80) imply that price may soon decrease as the security may be overbought. Conversely, low MFI values (below 20) suggest a potential price increase, as the security might be oversold. However, like all indicators, the MFI isn't infallible and should be used in conjunction with other technical analysis tools. Combining the MFI with other technical indicators can improve trade decision-making. For instance, using MFI alongside the RSI could provide a more balanced view of a security's momentum. Moreover, pairing MFI with moving averages or trendline analysis can help identify potential price reversal points. A common MFI-based trading strategy involves looking for divergence between the MFI and price. For instance, if the price hits a new high but the MFI doesn't, it suggests weakening momentum, and a price reversal could be imminent. Another strategy involves entering a long position when MFI moves above 20 (oversold boundary) and exiting when it crosses above 80 (overbought boundary). The MFI is a momentum oscillator that provides a numerical value between 0 and 100, indicating the speed and strength of price movements. It helps traders identify periods of strong buying or selling pressure, which can signal potential price reversals or trend continuations. The MFI can confirm the strength of a prevailing price trend. If the MFI is rising along with prices during an uptrend, it suggests that buying pressure is increasing and the trend is likely to continue. On the other hand, if the MFI is declining along with prices during a downtrend, it indicates that selling pressure is intensifying, reinforcing the downward trend. The MFI can help identify potential trend reversals by detecting divergences between price and the MFI line. A bullish divergence occurs when prices make lower lows, but the MFI makes higher lows, indicating weakening selling pressure and a potential trend reversal to the upside. Conversely, a bearish divergence occurs when prices make higher highs, but the MFI makes lower highs, suggesting weakening buying pressure and a potential trend reversal to the downside. The MFI incorporates volume data, which provides additional confirmation of price movements. High-volume buying or selling accompanied by a significant move in the MFI suggests strong market participation and increases the reliability of the MFI signals. The MFI can be used on various timeframes, from intraday to longer-term charts. Traders and investors can adjust the period and parameters of the MFI based on their preferred trading style and the timeframe they are analyzing. Like many other technical analysis tools, the MFI is a lagging indicator, meaning it relies on past price and volume data to generate signals. By the time a signal is generated, the price move may have already occurred or the market conditions may have changed. Therefore, it's important to use the MFI in conjunction with other indicators or analysis methods to confirm signals and avoid delayed responses. The MFI can be sensitive to sudden price and volume fluctuations, particularly in highly volatile markets. Extreme spikes or drops in price and volume can lead to false or misleading MFI readings, potentially generating false signals. Traders should exercise caution and consider using additional filters or confirming indicators to reduce the impact of market volatility. While the MFI can provide insights into the strength and direction of price movements, it doesn't have predictive power to accurately forecast future price levels or market behavior. It is primarily a tool for identifying current market conditions and potential reversals based on past price and volume data. The MFI requires the selection of parameters, such as the time period, to calculate the index. The choice of these parameters can affect the accuracy and reliability of the signals generated. Different traders may have varying preferences for the MFI parameters, leading to inconsistent results and interpretations. It's important to test and adjust the parameters to fit the specific market and timeframe being analyzed. The MFI is most effective in trending markets where there is a clear buying or selling pressure. In range-bound or sideways markets, where prices are moving within a defined range, the MFI signals may be less reliable and generate false indications of trend reversals. Traders should consider using alternative indicators or strategies when market conditions are not conducive to MFI analysis. The MFI solely focuses on price and volume data, without incorporating fundamental factors such as news, economic events, or company-specific information. Fundamental factors can have a significant impact on market movements and can override or invalidate the signals generated by the MFI. The Money Flow Index is a valuable momentum indicator that combines price and volume data to assess market sentiment and predict potential price reversals. Its ability to gauge buying and selling pressure in the markets has made it a popular tool among technical traders. The MFI provides insights into the strength and direction of price movements, confirms price trends, detects divergences, and incorporates volume data for additional confirmation. However, it is important to note that the MFI is a lagging indicator and should be used in conjunction with other analysis methods to avoid delayed responses. It can be sensitive to volatile markets and may generate false signals, requiring caution and the use of additional filters. The MFI's parameter selection and limited applicability in range-bound markets should also be considered, and fundamental factors should not be overlooked in conjunction with MFI analysis. The MFI is a versatile tool that can be applied across various timeframes, but its effectiveness depends on proper interpretation and integration with other indicators and market analysis techniques.What Is the Money Flow Index (MFI)?
Understanding the MFI Concept
Basics of the MFI
The Relevance of MFI in Financial Markets
Difference Between MFI and Other Technical Indicators
Mathematical Formula for Money Flow Index
Explanation of the Formula Components
Practical Examples Using the MFI Formula
Utilization of Software Tools for Calculation
How to Interpret Money Flow Index Values
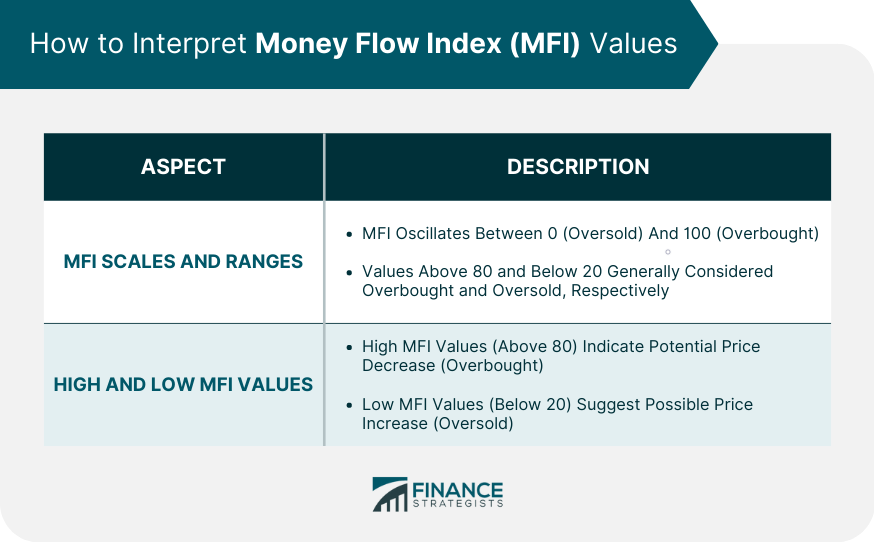
MFI Scales and Ranges
High and Low MFI Values
Money Flow Index in Trading Strategies
Combining With Other Indicators
Examples of Trading Strategies Involving the MFI
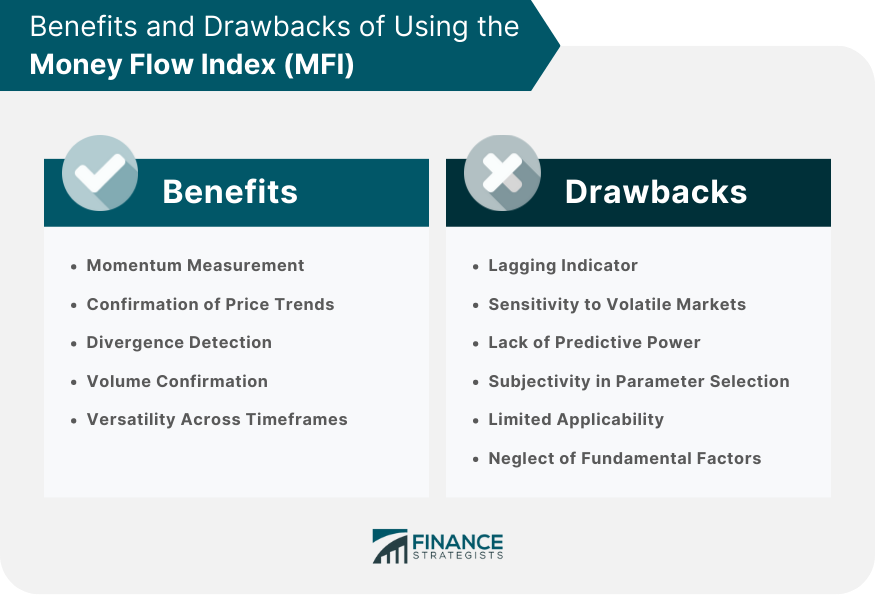
Benefits of Using the Money Flow Index
Momentum Measurement
Confirmation of Price Trends
Divergence Detection
Volume Confirmation
Versatility Across Timeframes
Drawbacks of Using the Money Flow Index
Lagging Indicator
Sensitivity to Volatile Markets
Lack of Predictive Power
Subjectivity in Parameter Selection
Limited Applicability
Neglect of Fundamental Factors
Final Thoughts
Money Flow Index (MFI) FAQs
The most commonly used period setting for MFI calculation is 14 periods. However, traders can adjust this parameter based on their preferred trading style and the timeframe they are analyzing.
No, the MFI is a lagging indicator and does not have predictive power to accurately forecast future price levels or market behavior. It primarily helps identify current market conditions and potential reversals based on past price and volume data.
The MFI is a volume-weighted version of the RSI. While the RSI considers only price movements, the MFI incorporates volume data, providing a more comprehensive perspective on market dynamics and the force behind price moves.
While the MFI is a valuable indicator, it is generally recommended to use it in conjunction with other technical analysis tools. Combining the MFI with indicators like moving averages or trendline analysis can help validate signals and enhance trade decision-making.
No, the MFI solely focuses on price and volume data and does not incorporate fundamental factors such as news, economic events, or company-specific information. Traders should consider integrating fundamental analysis alongside the MFI for a more comprehensive understanding of market movements.
True Tamplin is a published author, public speaker, CEO of UpDigital, and founder of Finance Strategists.
True is a Certified Educator in Personal Finance (CEPF®), author of The Handy Financial Ratios Guide, a member of the Society for Advancing Business Editing and Writing, contributes to his financial education site, Finance Strategists, and has spoken to various financial communities such as the CFA Institute, as well as university students like his Alma mater, Biola University, where he received a bachelor of science in business and data analytics.
To learn more about True, visit his personal website or view his author profiles on Amazon, Nasdaq and Forbes.


