
The Head and Shoulders pattern is a technical analysis pattern used in wealth management to identify potential trend reversals. It consists of three successive peaks, with the middle peak (the head) being higher than the two surrounding peaks (the shoulders). The pattern is characterized by a neckline, which acts as a support or resistance level. The Head and Shoulders pattern is significant in wealth management as it provides traders and investors with a visual representation of a potential trend reversal. By recognizing and understanding this pattern, traders can make informed decisions about market entry and exit points, manage their risk effectively, and optimize their trading strategies. The Head and Shoulders pattern is one of the most widely recognized and reliable reversal patterns in technical analysis. Its presence on a price chart often suggests that the previous trend is losing momentum and that a reversal is likely to occur. Traders who can identify and interpret this pattern have an advantage in predicting potential market shifts and adjusting their trading positions accordingly. The formation of the Head and Shoulders pattern begins with the left shoulder, which represents the first peak of the pattern. It is formed when the price reaches a high point, followed by a retracement before continuing its upward movement. The head is the central peak of the pattern and is characterized by a higher high compared to the left and right shoulders. It represents the highest point in the pattern and often attracts significant buying or selling activity. The right shoulder is formed after the head and is similar in height to the left shoulder. It is formed when the price retraces again after the head, creating a second peak that is lower than the head. The neckline is a trendline drawn across the lows of the pattern, connecting the low points between the left shoulder, head, and right shoulder. It acts as a support or resistance level and plays a crucial role in confirming the pattern. Traders analyze the characteristics of the Head and Shoulders pattern to identify its presence on a price chart and determine potential trading opportunities. To identify the Head and Shoulders pattern, traders look for the formation of the left shoulder. It should be a significant peak followed by a retracement. The identification of the head is essential as it serves as the highest peak in the pattern. Traders look for a higher high compared to the left and right shoulders. Traders identify the right shoulder by observing a second peak that is lower than the head but similar in height to the left shoulder. The confirmation of the Head and Shoulders pattern occurs when the price breaks below the neckline, which acts as a support level. This breakout confirms the potential trend reversal and provides traders with a signal to enter short positions or exit long positions. By recognizing and confirming the presence of the Head and Shoulders pattern, traders can take advantage of potential trend reversals and adjust their trading strategies accordingly. The Head and Shoulders pattern is considered a reliable reversal pattern that indicates a potential shift in the market trend. The presence of this pattern suggests that the previous trend is losing momentum and that a reversal is likely to occur. Traders can use this pattern to identify potential trend reversals and adjust their trading positions accordingly. Traders often use the Head and Shoulders pattern to determine price targets and establish stop-loss levels. The pattern's structure provides a framework for setting profit targets by measuring the distance from the head to the neckline and projecting it downward from the neckline. Stop-loss levels are typically placed above the pattern's right shoulder to manage risk and protect against potential false breakouts or pattern failures. The Head and Shoulders pattern also plays a role in risk management and position sizing. Traders can adjust their position sizes based on the pattern's reliability and the distance between the entry point and the stop-loss level. This helps control risk and maintain a consistent risk-to-reward ratio. Traders can utilize the Head and Shoulders pattern to time their entries and exits in the market. Once the pattern is confirmed with a neckline breakout, traders can enter short positions or exit long positions. Additionally, traders may consider using other technical indicators or price patterns to further validate their trading decisions and increase the probability of success. By understanding the significance of the Head and Shoulders pattern in wealth management, traders can incorporate it into their analysis and trading strategies effectively. Like any technical analysis pattern, the Head and Shoulders pattern is not infallible. Traders should be aware of the possibility of false signals and pattern failure, where the price does not reverse as expected after the pattern is confirmed. To mitigate the risk of false signals, traders often look for additional confirming factors, such as volume analysis, other technical indicators, or the presence of other price patterns. This multi-dimensional approach helps increase the reliability of the pattern and reduces the likelihood of being caught in false breakouts. Traders should consider using other technical indicators in conjunction with the Head and Shoulders pattern to confirm potential trading opportunities. Indicators such as oscillators, moving averages, or volume indicators can provide additional insights and strengthen the validity of the pattern. By incorporating multiple indicators, traders can increase their confidence in the potential trend reversal indicated by the Head and Shoulders pattern and make more informed trading decisions. Market conditions and volatility can impact the reliability of the Head and Shoulders pattern. During periods of low trading volume or high volatility, the pattern may be less reliable, resulting in false signals or pattern failure. Traders should be mindful of the prevailing market conditions and adjust their trading strategies accordingly. Additionally, it is essential to consider the timeframe of the chart being analyzed, as the significance of the pattern may vary depending on the timeframe. The Head and Shoulders pattern is a technical analysis pattern used to identify potential trend reversals. It consists of three peaks with the middle peak being higher than the two surrounding peaks. The pattern's presence on a price chart suggests a potential shift in market sentiment. Traders recognize the Head and Shoulders pattern by identifying the left shoulder, head, right shoulder, and confirming the pattern with a neckline break. These steps help identify potential trading opportunities and signal potential trend reversals. Recognizing and understanding the Head and Shoulders pattern is crucial in wealth management as it provides traders and investors with insights into potential trend reversals. By incorporating this pattern into their analysis and trading strategies, traders can optimize their decision-making, manage risk effectively, and enhance their overall trading performance.What Is the Head and Shoulders Pattern?
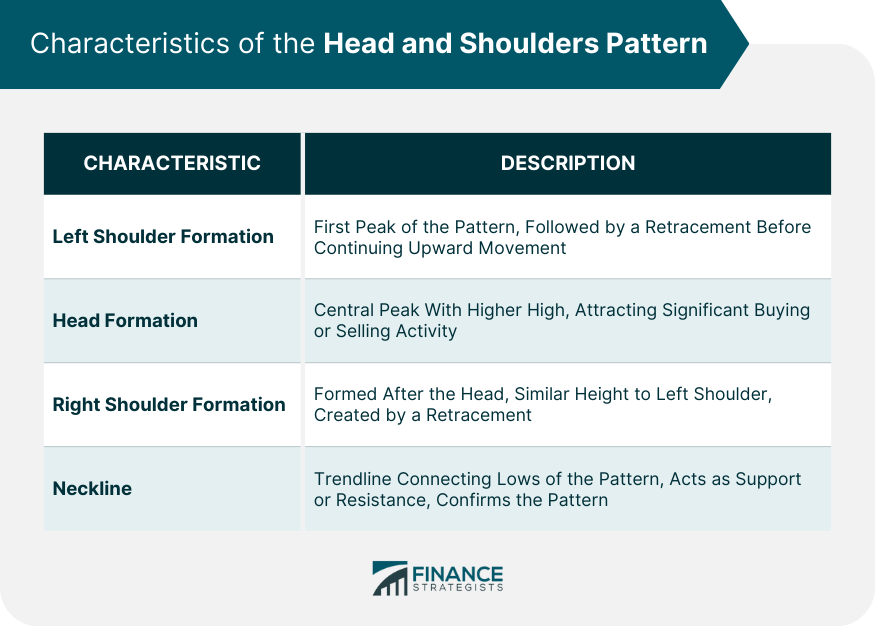
Characteristics of the Head and Shoulders Pattern
Formation of the Left Shoulder
Formation of the Head
Formation of the Right Shoulder
Neckline
Recognition of the Head and Shoulders Pattern
Identifying the Left Shoulder
Identifying the Head
Identifying the Right Shoulder
Confirming the Pattern With the Neckline Break
Significance of the Head and Shoulders Pattern in Wealth Management
Reversal Pattern Indicating Trend Reversal
Price Targets and Stop-Loss Levels
Risk Management and Position Sizing
Timing Entries and Exits
Limitations and Considerations
False Signals and Pattern Failure
Confirmation Through Other Technical Indicators
Market Conditions and Volatility
Conclusion
Head and Shoulders Pattern FAQs
The Head and Shoulders pattern is a technical analysis pattern characterized by three peaks, with the middle peak (the head) being higher than the two surrounding peaks (the shoulders). It suggests a potential trend reversal.
The Head and Shoulders pattern is identified by recognizing the formation of the left shoulder, head, and right shoulder, as well as confirming the pattern with a neckline break.
The Head and Shoulders pattern is significant as it indicates potential trend reversals, allowing traders to make informed decisions about market entry and exit points, manage risk effectively, and optimize their trading strategies.
The Head and Shoulders pattern helps traders establish price targets and stop-loss levels, control risk by adjusting position sizes, and time their entries and exits in the market.
The Head and Shoulders pattern is not infallible and can produce false signals or pattern failure. Traders should consider confirming the pattern with other technical indicators, be aware of market conditions and volatility, and adjust their strategies accordingly.
True Tamplin is a published author, public speaker, CEO of UpDigital, and founder of Finance Strategists.
True is a Certified Educator in Personal Finance (CEPF®), author of The Handy Financial Ratios Guide, a member of the Society for Advancing Business Editing and Writing, contributes to his financial education site, Finance Strategists, and has spoken to various financial communities such as the CFA Institute, as well as university students like his Alma mater, Biola University, where he received a bachelor of science in business and data analytics.
To learn more about True, visit his personal website or view his author profiles on Amazon, Nasdaq and Forbes.


