
The Fractal Indicator is an analytical tool widely used in the technical analysis of financial markets. It is premised on the Fractal theory formulated by mathematician Benoit Mandelbrot, which stipulates that markets' price movements exhibit repeating patterns at various scales, also known as fractals. Fractals are a series of at least five successive bars, with the highest high in the middle, and two lower highs on both sides. This indicator identifies reversal points in the market, giving traders the potential to spot significant price movements before they occur. Given that financial markets exhibit fractal characteristics — patterns repeating on different scales — the Fractal Indicator can help traders identify potential price reversals, making it an essential component of wealth management strategies. Through its ability to detect patterns in price data, the Fractal Indicator helps traders predict market behavior with greater accuracy. This added foresight aids traders in formulating robust strategies, thus enabling them to manage their portfolios more effectively. Fractals are essentially self-similar patterns, meaning they exhibit the same pattern regardless of the scale at which they are observed. In a financial market context, this means that price movements often echo past movements, albeit on different scales. The concept of self-similarity forms the foundation of the Fractal Indicator. By identifying these repeating patterns, the indicator allows traders to make informed predictions about future market behavior. Fractals are characterized by infinite detail. That is, no matter how closely you look, you can always see more details. In financial markets, this implies that price movements can always be broken down into smaller movements that reflect the larger pattern. This characteristic is particularly important when using the Fractal Indicator. By analyzing price movements at different scales, the indicator enables traders to gain a more nuanced understanding of market trends. Fractals are inherently non-linear, meaning that they are not straight lines or simple curves. Instead, they involve complex patterns that can appear chaotic or disorderly. In the financial markets, this non-linearity is reflected in the often unpredictable nature of price movements. Despite the seeming randomness of these patterns, the Fractal Indicator can identify underlying structures in the chaos. This ability allows traders to spot trends and make more accurate predictions about future market behavior. One of the primary applications of the Fractal Indicator is in identifying potential market reversals. This capability stems from the indicator's ability to spot repeating patterns in price data, which often precede significant price reversals. By alerting traders to these potential reversals, the Fractal Indicator provides an opportunity to capitalize on major market movements. This ability can give traders a substantial edge, especially in volatile markets. The Fractal Indicator also plays a critical role in assessing market trends. By analyzing price data at different scales, the indicator can identify underlying trends that might otherwise be obscured by market noise. Through this capability, the Fractal Indicator helps traders to gain a deeper understanding of market dynamics. This insight can inform more robust trading strategies, enhancing traders' ability to navigate complex market conditions. In addition to identifying market reversals and assessing trends, the Fractal Indicator is also effective in determining support and resistance levels. These levels are crucial in technical analysis as they indicate the price points at which an asset's price is likely to bounce back or face rejection. With its pattern-recognizing capabilities, the Fractal Indicator provides traders with valuable insights into these potential bounce or break points. This information can guide traders in making strategic decisions, such as setting stop-loss or take-profit orders. The Fractal Indicator generates both bullish and bearish signals. A bullish fractal occurs when a low point is made by a sequence of five bars in which the lowest low is preceded by two higher lows and followed by two higher lows. Conversely, a bearish fractal forms when a sequence of five bars results in the highest high being followed and preceded by lower highs. These patterns provide valuable signals about potential market movements. Bullish fractals may indicate a potential upward price movement, while bearish fractals suggest a possible downward price movement. While the Fractal Indicator can provide valuable market insights, it is typically used in combination with other technical indicators for confirmation. These might include indicators such as the Alligator Indicator, Moving Average, or Relative Strength Index. The use of multiple indicators helps to reduce the risk of false signals and enhances the reliability of trading signals. By combining the insights provided by the Fractal Indicator with those from other technical analysis tools, traders can formulate more robust and reliable trading strategies. One of the key advantages of the Fractal Indicator is its flexibility and adaptability. Given that fractals are inherent in all price movements, the Fractal Indicator can be applied across different financial markets and time frames. This versatility makes the Fractal Indicator an invaluable tool for traders, enabling them to analyze a wide range of markets and scenarios. It's a go-to resource for those seeking a flexible, adaptable analysis tool. The Fractal Indicator's ability to identify repeating patterns in price data allows it to detect potential trend reversals early. By providing traders with an early warning about potential price changes, the Fractal Indicator can offer a substantial edge. Early detection of trend reversals enables traders to position themselves advantageously ahead of significant market movements. This head start can be crucial in high-speed, high-stakes trading environments. Despite its complex mathematical foundations, the Fractal Indicator is surprisingly simple and easy-to-use. Most trading platforms come with a built-in Fractal Indicator that automatically identifies fractal patterns on the price chart. This simplicity and accessibility make the Fractal Indicator a popular choice among traders, particularly those who are new to technical analysis. Its user-friendly nature doesn't undermine its effectiveness, making it a win-win tool for traders of all experience levels. One of the main limitations of the Fractal Indicator is the degree of subjectivity involved in identifying fractal patterns. Because fractals are not specific shapes but rather complex, repeating patterns, there can be some ambiguity in their identification. This subjectivity can potentially lead to differing interpretations among traders, affecting the consistency and reliability of the indicator. Traders should be aware of this limitation and apply the Fractal Indicator judiciously. During periods of high market volatility, the Fractal Indicator can produce whipsaw signals. Whipsaws occur when the price of an whipsaw signals quickly in different directions, resulting in the generation of conflicting trading signals. These whipsaw signals can cause confusion and potentially lead to losses if not managed properly. As such, it's crucial to use the Fractal Indicator in conjunction with other technical analysis tools to verify its signals during volatile market conditions. The Fractal Indicator can be sensitive to market noise and may generate false signals. Market noise refers to random price fluctuations that can often obscure the underlying trend. Because the Fractal Indicator relies on pattern recognition, it may occasionally misinterpret random price fluctuations as significant patterns. To mitigate the risk of false signals, traders should use the Fractal Indicator in combination with other technical analysis tools. The Fractal Indicator is a versatile tool used in technical analysis. By identifying repeating patterns in price data, it provides traders with valuable insights into potential market reversals and trends. This indicator is a staple in effective wealth management strategies. The Fractal Indicator operates by recognizing fractal patterns in financial markets. These patterns, which reflect self-similarity, infinite detail, and non-linearity, enable the indicator to identify market reversals, assess market trends, and determine support and resistance levels. The Fractal Indicator offers several advantages, including flexibility, early detection of trend reversals, and ease of use. However, it also has its limitations, such as subjectivity in identifying fractal patterns, potential for whipsaw signals during market fluctuations, and sensitivity to market noise.What Is the Fractal Indicator?
Importance of the Fractal Indicator
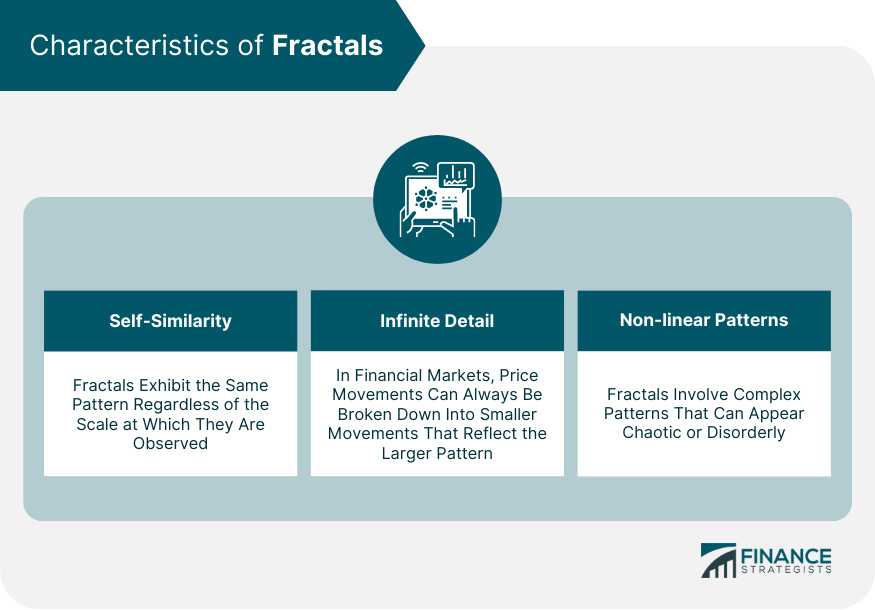
Characteristics of Fractals
Self-Similarity
Infinite Detail
Non-linear Patterns
How the Fractal Indicator Works in Financial Markets
Identifying Market Reversals
Assessing Market Trends
Determining Support and Resistance Levels
Interpretation of Fractal Indicators
Bullish and Bearish Signals
Confirmation With Other Technical Indicators
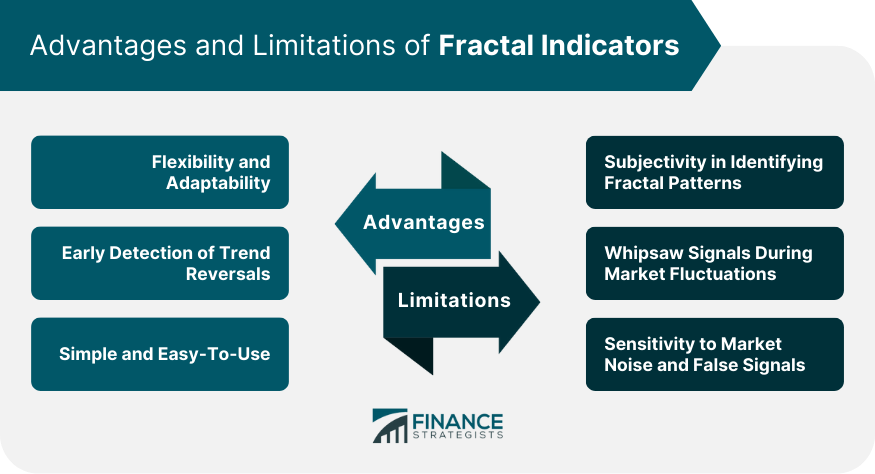
Advantages of Fractal Indicators
Flexibility and Adaptability
Early Detection of Trend Reversals
Simple and Easy-To-Use
Limitations of Fractal Indicators
Subjectivity in Identifying Fractal Patterns
Whipsaw Signals During Market Fluctuations
Sensitivity to Market Noise and False Signals
Conclusion
Fractal Indicator FAQs
The Fractal Indicator is a tool used in technical analysis that identifies repeating patterns in price data.
The Fractal Indicator works by identifying fractal patterns in financial markets, which enables it to spot market reversals, assess market trends, and determine support and resistance levels.
The Fractal Indicator offers several advantages, such as flexibility and adaptability, early detection of trend reversals, and simplicity.
Fractal Indicators have limitations, including subjectivity in identifying fractal patterns, the potential for whipsaw signals during market fluctuations, and sensitivity to market noise.
In wealth management, the Fractal Indicator can be used to predict market behavior, formulate robust trading strategies, and manage portfolios more effectively.
True Tamplin is a published author, public speaker, CEO of UpDigital, and founder of Finance Strategists.
True is a Certified Educator in Personal Finance (CEPF®), author of The Handy Financial Ratios Guide, a member of the Society for Advancing Business Editing and Writing, contributes to his financial education site, Finance Strategists, and has spoken to various financial communities such as the CFA Institute, as well as university students like his Alma mater, Biola University, where he received a bachelor of science in business and data analytics.
To learn more about True, visit his personal website or view his author profiles on Amazon, Nasdaq and Forbes.


