
A Double Bottom is a bullish reversal pattern, typically seen in technical analysis of financial markets. This pattern emerges at the end of a protracted bear market, visually resembling the letter 'W'. It signifies that the price has hit a significant level of support twice and bounced back, hinting at a reversal of the bearish trend. The Double Bottom pattern originated from the early days of stock market charting in the 20th century. Charles Dow, the father of modern technical analysis, alluded to such formations in his work, though the exact term "Double Bottom" was not explicitly used. The Double Bottom became a more well-known concept with the publication of technical analysis books, like those by John J. Murphy. Over the years, this pattern has been widely used by traders and investors across the globe, due to its relative simplicity and effectiveness in predicting potential trend reversals. The Double Bottom has four main components. Firstly, the two distinct troughs or bottoms, approximately equal in price. Secondly, the peak in between these two bottoms, known as the reaction high. Thirdly, the confirmation point, which is when the price breaks above the reaction high. Lastly, the volume dynamics throughout the formation, where it is typically higher during the formation of the first bottom and lower at the second, with a noticeable increase during the breakout. The formation of the Double Bottom pattern typically occurs over an extended period, ranging from a few weeks to several months. It begins with a strong downward move, leading to the formation of the first bottom. Following this, a rebound move occurs, forming the reaction high. After the reaction high, the price declines again to form the second bottom. The pattern is completed when the price breaks out above the reaction high, confirming the bullish reversal. The primary role of a Double Bottom in technical analysis is to signal a potential trend reversal. Upon the pattern's confirmation, a bearish trend is expected to reverse into a bullish one. Hence, it provides an excellent opportunity for traders to enter the market long, betting on the forthcoming upward trend. Once the Double Bottom pattern is confirmed by a breakout, traders often predict potential price movements using the pattern's height. The height, measured from the bottom to the reaction high, is added to the breakout point to get a target price for the upcoming bullish trend. Traders can identify Double Bottom patterns visually by looking for the distinctive 'W' shape in price charts. However, they must be cautious of the characteristics discussed earlier, particularly the breakout above the reaction high, to confirm the pattern. Many trading platforms and software tools offer pattern recognition features. Traders can use these to automate the identification of Double Bottom patterns, saving time and mitigating the risk of missing potential trading opportunities. Volume plays a crucial role in confirming the Double Bottom pattern. An increase in volume during the breakout above the reaction high reinforces the pattern's validity, indicating strong buying interest and making a bullish trend reversal more probable. The confirmation of the Double Bottom pattern comes when the price breaks above the reaction high. It is this breakout that indicates the bearish trend is over and a new bullish trend has begun. Traders often wait for this confirmation before initiating long positions. Upon the confirmation of the Double Bottom pattern, traders usually enter long positions. The breakout above the reaction high provides an ideal entry point, as it suggests the commencement of a bullish trend. The placement of stop-loss orders is vital in any trading strategy. In the case of a Double Bottom, a common practice is to place the stop-loss order just below the second bottom. This minimizes potential losses if the assumed bullish reversal fails to materialize. Traders often set profit targets based on the pattern's height. By adding the height to the breakout point, they can estimate a potential target price for the new bullish trend. Identifying a double bottom pattern requires subjective interpretation. Different traders may have varying opinions on where to draw the neckline or whether a pattern qualifies as a double bottom. This subjectivity can lead to inconsistent results and false signals. Like any technical analysis pattern, the double bottom is not foolproof and can generate false signals. The pattern may appear to be forming, but the subsequent price movement may not follow the expected bullish reversal. Traders should be cautious and use additional confirmation indicators or tools to reduce the likelihood of false signals. The reliability of the double bottom pattern can vary depending on the timeframe being analyzed. It may work well in longer timeframes like daily or weekly charts but may be less effective in shorter timeframes like intraday charts. Additionally, the market can experience whipsaws, where the price briefly breaks below the second bottom, triggering stop-loss orders before reversing back up. These false breakouts can lead to losses and frustration. Relying solely on the double bottom pattern without considering broader market conditions and fundamental analysis can be risky. It's important to understand the overall market trend, news events, and other factors that can influence price movements. Ignoring these contextual factors may result in poor trading decisions. The double bottom pattern is widely known and used by many traders, which can reduce its effectiveness. As more market participants look for the same pattern, it can become a self-fulfilling prophecy, leading to crowded trades and less reliable signals. Overuse of the pattern can make it less effective and potentially increase the risk of false signals. Waiting for confirmation of the double bottom pattern before entering a trade can lead to missed opportunities. By the time the pattern is confirmed, the price may have already made a significant move, reducing the potential profit or increasing the risk of entering at an unfavorable price level. The Head and Shoulders pattern is another widely recognized chart pattern, signifying a bearish reversal. This pattern differs from the Double Bottom as it forms after an uptrend and indicates a possible downtrend. It appears as a peak (shoulder), followed by a higher peak (head), and then a lower peak (shoulder), giving the appearance of a human silhouette. The Cup and Handle pattern is a bullish continuation pattern, often appearing mid-trend. It visually represents a period of consolidation and is followed by a breakout, similar to the Double Bottom. However, unlike the Double Bottom, it doesn't necessarily indicate a trend reversal, and the "cup" part of the pattern can extend over a longer period. The Ascending Triangle is a bullish pattern that differs from the Double Bottom as it showcases higher lows and consistent highs. While both patterns culminate in a bullish breakout, the Ascending Triangle signifies a strong uptrend, with buyers gradually overcoming sellers. The Double Bottom is a bullish reversal pattern appearing at the end of a bearish trend, signifying a potential reversal. It is characterized by two distinct troughs of approximately equal price and a breakout above the intervening reaction high. With its origins in early stock market charting, this pattern has stood the test of time and remains popular among traders and investors due to its relative simplicity and effectiveness. By identifying the pattern's distinct characteristics and using confirmation through volume and breakout, traders can leverage the Double Bottom pattern to identify potential trend reversals and predict price movements. However, it is important to acknowledge the risks and limitations associated with using the Double Bottom pattern. Subjectivity and interpretation can lead to inconsistent results and false signals, highlighting the need for additional confirmation indicators or tools. The pattern's reliability can also vary depending on the timeframe analyzed, and false breakouts can result in losses. Moreover, relying solely on the pattern without considering broader market conditions and fundamental analysis can be risky, and overuse of the pattern may reduce its effectiveness. Traders should carefully assess these factors and strike a balance between confirmation and the potential for missed opportunities when implementing the Double Bottom pattern in their trading strategies. While understanding and implementing trading patterns like the Double Bottom can enhance trading decision-making, it's essential to consult with a financial advisor or do a comprehensive research before making any significant financial decisions. Markets can be volatile, and while patterns can provide guidance, they can never guarantee success. Hence, maintaining a balanced and informed perspective is crucial to successful trading.What Is a Double Bottom?
Understanding the Double Bottom Pattern
Key Characteristics
Stages of Formation
Role of Double Bottoms in Technical Analysis
Identifying Trend Reversals
Predicting Potential Price Movements
Identification of Double Bottoms in Real-Time Trading
Visual Identification
Using Software Tools
Confirmation of Double Bottoms
Through Volume
Through Breakout
Implementing Double Bottoms in Trading Strategy
Entry Points
Stop-Loss Placements
Profit Target Setting
Risks and Limitations of Using Double Bottoms
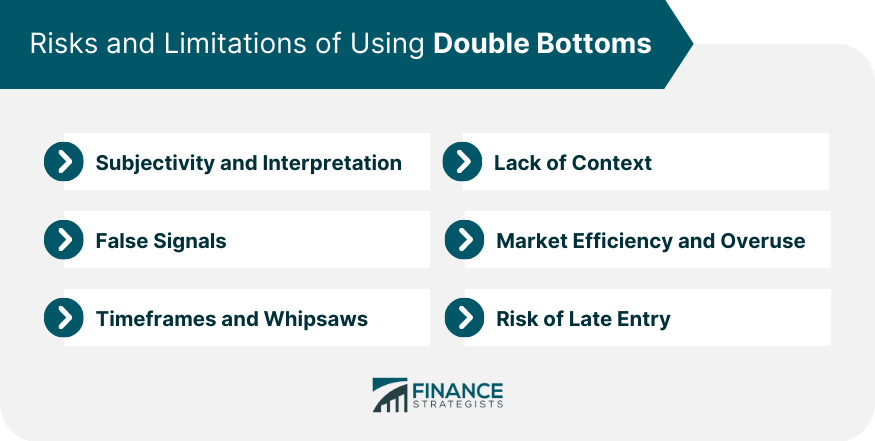
Subjectivity and Interpretation
False Signals
Timeframes and Whipsaws
Lack of Context
Market Efficiency and Overuse
Risk of Late Entry
Comparison of Double Bottoms With Other Chart Patterns
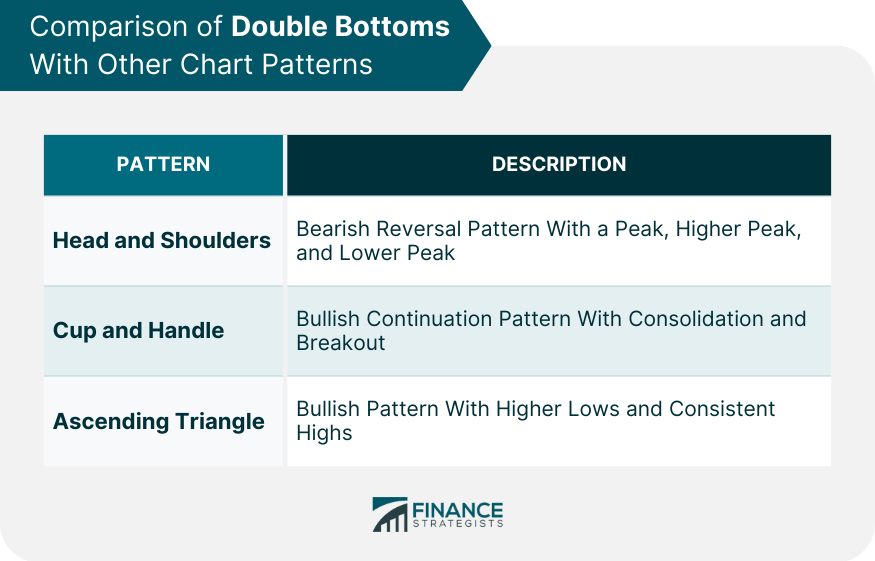
Head and Shoulders
Cup and Handle
Ascending Triangle
Final Thoughts
Double Bottom FAQs
The Double Bottom pattern serves as a bullish reversal signal, indicating a potential shift from a bearish trend to a bullish one.
Traders can visually identify a Double Bottom pattern by looking for the distinctive 'W' shape on price charts. Confirmation of the pattern occurs when the price breaks above the reaction high.
Yes, there are risks. The pattern is subjective and open to interpretation, leading to inconsistent results and false signals. Traders should also consider the timeframe analyzed, as the pattern's reliability can vary, and there is a risk of late entry, missing potential opportunities.
Volume is crucial in confirming the Double Bottom pattern. An increase in volume during the breakout above the reaction high strengthens the pattern's validity, indicating strong buying interest and a higher probability of a bullish trend reversal.
While the Double Bottom pattern can be applied to shorter timeframes, its reliability may be reduced compared to longer timeframes. Traders should consider the specific characteristics and tendencies of the timeframe they are analyzing to gauge the pattern's effectiveness.
True Tamplin is a published author, public speaker, CEO of UpDigital, and founder of Finance Strategists.
True is a Certified Educator in Personal Finance (CEPF®), author of The Handy Financial Ratios Guide, a member of the Society for Advancing Business Editing and Writing, contributes to his financial education site, Finance Strategists, and has spoken to various financial communities such as the CFA Institute, as well as university students like his Alma mater, Biola University, where he received a bachelor of science in business and data analytics.
To learn more about True, visit his personal website or view his author profiles on Amazon, Nasdaq and Forbes.


