
Key performance indicators, or KPIs, are a set of quantifiable measurements used to gauge the performance of a company. KPIs are often financial metrics, such as net profit or current ratios, but they can also include anecdotal metrics like foot traffic, employee retention, and customer experience. By setting benchmarks and targets, KPIs offer a clear picture of an organization's trajectory and its alignment with established goals. A company might also use KPIs to monitor sales growth, employee productivity, or customer retention. KPIs aren’t just numbers, they're insights. A rise or fall in a particular KPI can prompt a deeper investigation into underlying issues or trends. By using these indicators, businesses can be proactive in addressing areas of concern or capitalizing on emerging opportunities, ensuring sustained progress and growth. The purpose of key performance indicators is to help investors determine a company's strategic, operational, and financial achievements, particularly compared to other companies in the same sector. For example, if the average net profit margin for companies in a given industry is 50%, then a new company in that field knows it needs to reach at least that amount to remain competitive. Likewise, investors looking at those companies will be able to compare those figures to determine the worthiness of an investment. This class of KPIs homes in on an organization's ability to generate income and maintain profitability. Two core measures include Gross Profit Margin, which indicates how much profit a business makes after paying off its Cost of Goods Sold, and Net Profit Margin, which represents the remaining profit after all expenses are subtracted from revenue. Another critical profitability KPI is the Operating Profit Margin. This metric helps organizations determine how much profit they make before interest and taxes, shedding light on the operational efficiency of the business. By consistently monitoring these KPIs, companies can pinpoint areas for revenue enhancement or cost reduction. Liquidity KPIs evaluate the readiness of an enterprise to settle its short-term debts. A standard measure is the Current Ratio, which contrasts current assets against current liabilities. An optimum ratio ensures businesses have enough resources to meet short-term obligations without tapping into long-term assets. Efficiency KPIs, on the other hand, explore how well a company utilizes its assets. Turnover ratios, like Inventory Turnover or Accounts Receivable Turnover, can highlight areas where a firm may be tied up in assets that aren't effectively generating revenue. By enhancing efficiency, organizations can bolster their profitability and operational fluidity. Debt management is pivotal for an organization's long-term viability. Debt-to-Equity Ratio is a fundamental KPI that contrasts an organization's total liabilities with shareholders' equity. This metric provides stakeholders with a perspective on how much of the company's operations are financed through debt versus equity. Another notable measure is the Interest Coverage Ratio. It gauges a firm's ability to handle its interest expenses based on operational earnings. Companies with higher ratios can easily cover their interest costs, which generally signifies a lower risk for lenders and investors. Budget Variance Analysis examines the gap between a company's projected budget and its actual expenditure. Positive variances imply that expenses are under budget, while negative variances suggest overspending. It's crucial to discern the root causes of these variances. Moreover, analyzing budget variance can offer valuable insights into the company's financial health. For instance, recurrent negative variances might indicate systemic inefficiencies, whereas positive variances could mean overestimation in the budgeting phase or unexpected cost savings during operations. Forecast Accuracy measures the precision of financial predictions compared to actual outcomes. Accurate forecasts are essential for informed decision-making and planning. A consistent gap between forecasts and actual figures might indicate an issue in the forecasting process or changing market conditions. By fine-tuning their forecasting methods and regularly comparing projections to real-world outcomes, companies can better navigate future challenges and capitalize on opportunities. This proactive approach can lead to improved resource allocation and strategic planning. This ratio provides a clear snapshot of how a company's expenses align with its revenue. A lower ratio suggests that a company is efficiently producing revenue with minimal expenses, whereas a higher ratio might signal inefficiencies. Regularly monitoring the Expense-to-Revenue Ratio helps organizations identify potential inefficiencies and adapt strategies to improve profitability. Additionally, by contrasting this ratio with industry benchmarks, businesses can gauge their operational efficiency relative to competitors. ROI is a universally recognized KPI that measures the profitability of an investment. By comparing the net profit of an investment to its initial cost, ROI offers a percentage that signifies the investment's effectiveness in generating profit. Not only is ROI beneficial for internal evaluations, but it's also an essential metric for investors. A high ROI indicates that an investment has not just recouped its costs but has also generated a significant profit, which is always appealing to stakeholders. IRR is a metric used to determine the potential profitability of investments. Essentially, it's the discount rate that makes the Net Present Value of all cash flows from an investment equal to zero. An investment is typically considered good if its IRR exceeds the required rate of return. Understanding the IRR of an investment can provide businesses with a clearer picture of its potential value over time. Investments with higher IRRs are generally deemed more lucrative, as they promise better returns relative to the capital put in. The Payback Period refers to the time required for an investment to generate cash flows equal to its initial cost. A shorter payback period is typically more desirable, indicating quicker recoupment of investment costs. In environments marked by uncertainty, the Payback Period becomes especially significant. By determining how long it will take to break even on an investment, businesses can assess the associated risks and make informed decisions on pursuing or forgoing potential opportunities. VaR is a statistical measure that calculates the maximum potential loss an investment portfolio could face over a specific period for a given confidence interval. It's a crucial tool for risk managers and traders, offering a quantifiable metric for market risk. Using VaR, businesses can determine the risk threshold of their investments and establish strategies to mitigate potential losses. This measure, while not definitive, can guide risk-related decisions, especially in volatile markets. Credit Risk Exposure gauges the maximum potential loss a lender could incur if a borrower defaults on a loan. This KPI is particularly critical for financial institutions, as it enables them to assess the risk associated with their lending portfolios. Regularly evaluating Credit Risk Exposure ensures that a company maintains a balanced portfolio, with a mix of high and low-risk borrowers. This balance reduces the potential of massive losses from defaults and ensures a steady flow of interest income. Market Risk Sensitivity, often referred to as the beta coefficient, evaluates an investment's volatility compared to the broader market. A beta greater than one indicates that the investment is more volatile than the market, while a beta less than one suggests it's less volatile. Understanding an investment's market risk sensitivity is paramount for portfolio managers. By knowing how an asset is likely to respond to market fluctuations, they can create a diversified portfolio that balances high and low-risk investments, optimizing potential returns. The Working Capital Ratio, or Current Ratio, measures a company's ability to cover its short-term liabilities with its short-term assets. A ratio above one typically suggests that a company can comfortably meet its short-term obligations, indicating good financial health. A consistently strong Working Capital Ratio can enhance a company's creditworthiness and attract potential investors. Conversely, a ratio consistently below one might signal liquidity issues, prompting the need for operational adjustments. The Cash Conversion Cycle (CCC) evaluates how long it takes a company to convert resource inputs into cash flows. The shorter the cycle, the more efficiently a company is in managing its working capital. A streamlined CCC indicates that a company quickly moves from purchasing inventory to collecting cash from sales, optimizing its cash flow. Regularly monitoring this cycle can aid businesses in identifying bottlenecks and refining their operational strategies. EPS is a significant metric for shareholders, as it signifies the portion of a company's profit attributed to each outstanding share of common stock. A rising EPS can indicate profitability, attracting potential investors. Moreover, contrasting a company's EPS with those of its competitors can provide insights into its financial health and market position. Regularly evaluating EPS and understanding its fluctuations can offer valuable perspectives on a company's growth trajectory and its appeal to shareholders. KPIs offer tangible data that can objectively measure a company's performance. This data-driven approach ensures that assessments aren't just based on gut feelings or qualitative observations. Through KPIs, companies can set benchmarks, monitor progress, and implement strategies that directly address areas of concern. Additionally, by identifying performance trends over time, organizations can be proactive rather than reactive. This forward-thinking approach can lead to sustained growth and progress, as businesses can refine strategies based on concrete insights. Decision-making becomes more informed and strategic with KPIs. By providing clear, quantifiable insights into various operational and strategic areas, KPIs allow businesses to make decisions based on empirical data. For instance, if a company's Debt-to-Equity Ratio KPI shows a rising trend, management might decide to reduce borrowing or increase equity financing. Such informed decisions, grounded in tangible data, optimize operational efficiency and long-term sustainability. KPIs play a crucial role in aligning organizational goals across various departments. By establishing clear performance indicators, businesses ensure that all teams work towards a common objective, fostering cohesion and unity. Moreover, setting clear KPI targets can motivate employees. By understanding what's expected and having a tangible metric to work towards, staff can channel their efforts more effectively. Recognizing and rewarding those who meet or exceed KPI benchmarks can further boost morale and productivity. While KPIs offer valuable insights, they're only as good as the data they're based on. Inaccurate or outdated data can lead to misleading KPIs, which can misguide decision-making and strategy formulation. Maintaining data integrity is paramount. Organizations need to ensure that their data collection and analysis methods are robust, and that they regularly update and cleanse their databases. This diligence guarantees that KPIs remain relevant and reliable. Not all KPIs are suitable for every business. Choosing irrelevant or superfluous KPIs can divert attention from crucial areas, diluting focus and resources. It's essential for businesses to select KPIs that align with their goals, industry standards, and operational realities. Regularly reviewing and updating KPIs ensures they remain relevant. As businesses evolve and market dynamics shift, KPIs might need refining or replacement to reflect current realities and priorities. KPIs, while insightful, might not always account for external factors or market volatility. Unpredictable events, like economic downturns or global crises, can impact KPIs, making them appear unfavorable even if a company's internal operations are sound. It's crucial to interpret KPIs within a broader context, considering both internal operations and external market dynamics. This holistic approach ensures that KPIs remain relevant indicators of performance, even in fluctuating environments. KPIs can also vary between companies based on their criteria for success. For example, a software company aiming to achieve the fastest growth in its industry might consider year over year revenue growth as its most important KPI, whereas a retail store might rather look at same-store sales. Key Performance Indicators are quantifiable measurements that play a crucial role in assessing the performance and success of a company. They encompass various financial metrics, such as net profit and liquidity ratios, as well as non-financial metrics like customer experience and employee retention. KPIs offer insights that prompt deeper investigations into underlying issues or trends, enabling businesses to be proactive in addressing concerns and capitalizing on opportunities. The purpose of KPIs is to help investors determine a company's strategic, operational, and financial achievements, facilitating comparisons with other companies in the same sector. These indicators enhance decision-making through data-driven insights and align organizational goals, motivating employees to work towards a common objective. However, KPIs also have limitations, including reliance on accurate and relevant data, choosing appropriate indicators, and accounting for external market factors.What Is a Key Performance Indicator (KPI)?
What Is the Purpose of a KPI?
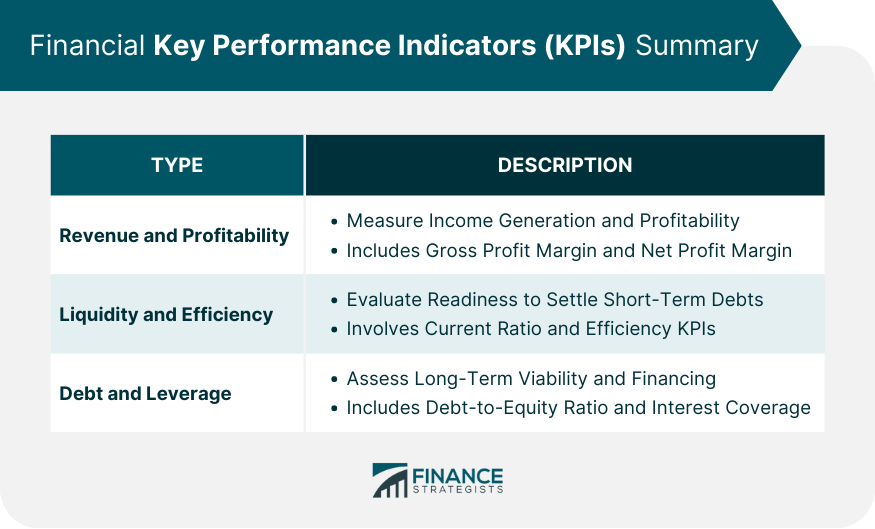
Types of Financial KPIs
Revenue and Profitability KPIs
Liquidity and Efficiency KPIs
Debt and Leverage KPIs
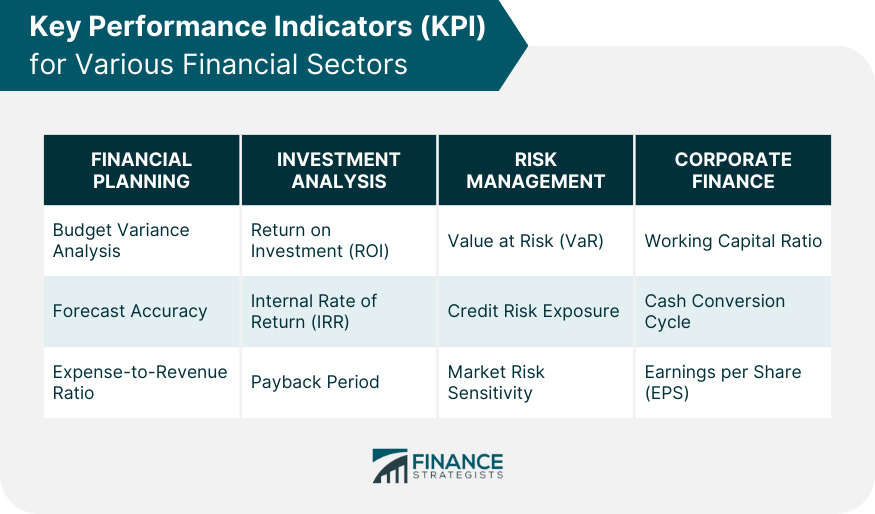
Key Performance Indicators for Financial Planning
Budget Variance Analysis
Forecast Accuracy
Expense-to-Revenue Ratio
Key Performance Indicators for Investment Analysis
Return on Investment (ROI)
Internal Rate of Return (IRR)
Payback Period
Key Performance Indicators for Risk Management
Value at Risk (VaR)
Credit Risk Exposure
Market Risk Sensitivity
Key Performance Indicators for Corporate Finance
Working Capital Ratio
Cash Conversion Cycle
Earnings per Share (EPS)
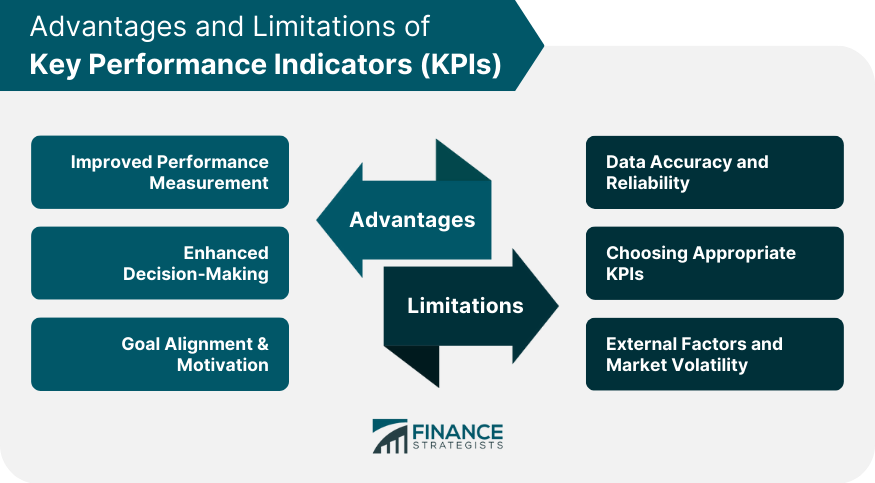
Advantages of Key Performance Indicators
Improved Performance Measurement
Enhanced Decision-Making
Goal Alignment & Motivation
Limitations of Key Performance Indicators
Data Accuracy and Reliability
Choosing Appropriate KPIs
External Factors and Market Volatility
KPI Example
Conclusion
Key Performance Indicators (KPI) FAQs
KPI is an acronym for Key Performance Indicator.
Key performance indicators, or KPIs, are a set of quantifiable measurements used to gauge the performance of a company.
The purpose of key performance indicators is to help investors determine a company’s strategic, operational, and financial achievements, particularly compared to other companies in the same sector.
KPIs can also vary between companies based on their criteria for success. For example, a software company aiming to achieve the fastest growth in its industry might consider year over year revenue growth as its most important KPI, whereas a retail store might rather look at same-store sales.
KPIs are often financial metrics, such as net profit or current ratios, but they can also include anecdotal metrics like foot traffic, employee retention, and customer experience.
True Tamplin is a published author, public speaker, CEO of UpDigital, and founder of Finance Strategists.
True is a Certified Educator in Personal Finance (CEPF®), author of The Handy Financial Ratios Guide, a member of the Society for Advancing Business Editing and Writing, contributes to his financial education site, Finance Strategists, and has spoken to various financial communities such as the CFA Institute, as well as university students like his Alma mater, Biola University, where he received a bachelor of science in business and data analytics.
To learn more about True, visit his personal website or view his author profiles on Amazon, Nasdaq and Forbes.


