
A profit and loss statement, also called an income statement or P&L statement, is a financial document that summarized the revenues, costs, and expenses incurred by a company during a specified period. Usually this is one fiscal quarter or fiscal year. It begins with an entry declaring overall revenue, also called the top line, and contains expense entries subtracting costs of doing business including the cost of goods sold, operating expenses, tax expenses, and interest expenses. The last item, known as the bottom line, shows the remainder as net income, or profit. The purpose of a P&L statement is to provide information about a company's overall ability to generate profit, either by increasing revenue or decreasing costs, or both. Along with the balance sheet and statement of cash flows, it is one of the three core financial documents that measure company performance. The P & L Statement offers a window into the profitability of a business. This is not just about knowing if money was made or lost. It delves deeper, shedding light on how efficiently a company operates, where it might be hemorrhaging money, or areas where revenue generation shines. Revenue or sales is the total amount earned from selling goods or services before any costs or expenses are deducted. It's the lifeline, the starting point. Without it, there's no business. For most businesses, this figure doesn’t just represent a static number. It embodies the direct outcome of their marketing, sales, and product strategies. When this figure grows, businesses know they're onto something; when it dwindles, it's a clarion call to introspection. This metric reflects the direct costs involved in producing the goods or services sold by a company. Think of raw materials, labor costs involved in production, and manufacturing overhead. While revenue signals potential profitability, COGS is the pinch that reminds businesses of the cost of doing business. The tension between revenue and COGS is fundamental. A business selling high but producing at exorbitant costs is a ship sailing towards a storm. Subtract COGS from Revenue, and the residue is your Gross Profit. This is the money left after production costs, serving as a preliminary indicator of profitability. However, Gross Profit doesn't account for other expenses that companies incur. Yet, it's essential as it offers an initial glimpse into the efficiency of the production and pricing processes. Operating expenses cover administrative, general, and selling expenses not directly tied to production. These expenses can be as varied as salaries, rent, and advertising costs. While they don't have the direct impact of COGS, they're crucial for business operations and often represent areas where cost-efficiencies can be introduced. With Gross Profit in hand and Operating Expenses listed out, the difference gives us the Operating Income. This metric gives stakeholders an insight into the money made from core operations. In the vast tapestry of a P&L statement, Operating Income is pivotal. It disregards anomalies or external factors, focusing only on the core business functions. It's a pure view of how well the business 'businesses'. Not all sources of income or expenses come from the main hustle. Some originate from secondary activities, like investments or property. The “Other” category captures this. However, it's vital to differentiate these from the core activities. They can be volatile, unpredictable, or even one-off events. Clubbing them with regular income or expenses can paint a distorted image of business health. After accounting for every income and expense, including the "other" category, businesses arrive at a pre-tax figure. This is the money before the taxman takes his share, and it offers a clear picture of profitability from operations and secondary activities combined. No earnings report is complete without acknowledging the slice that goes to the government. Income Taxes reflect this share, serving as a reminder that not all earnings translate to net profit. The final piece of the puzzle. After all deductions, including taxes, the remaining amount represents the company’s net profit. It's the bottom line, the figure most stakeholders dart their eyes towards. It’s the culmination of all business activities and decisions reflected in one number. The single-step P&L Statement operates on this principle, collating all revenues and subtracting all expenses in one clean sweep. No fuss, no layers—just a straightforward calculation. However, while its simplicity is admirable, it might not capture the nuance of different revenue sources and varied expenses. This format is often used by smaller businesses or for internal reviews where simplicity trumps detail. The multi-step P&L offers a richer, layered view of finances. By separating operational and non-operational revenues and expenses, it provides a more nuanced snapshot of a business's health. This format is the go-to for larger corporations and those keen on presenting a detailed picture to stakeholders. It sheds light on operational efficiency while also capturing the impact of peripheral activities. At its essence, the P&L statement serves as a report card for businesses. It showcases how well a company performed over a specific period. The highs, the lows, the unexpected turns—they’re all there. It's not just about profitability, though that's a significant part. The P&L statement reveals areas of efficiency, zones of wastage, and potential growth spots. It's the map guiding businesses on their future course. Decision-making in business is a blend of intuition and cold, hard data. The P&L statement provides the latter. Analysts pore over it, extracting insights, drawing parallels, and forecasting trends. From investment decisions to strategy pivots, the data in P&L statements acts as the north star, guiding companies with empirical evidence. It's the difference between shooting in the dark and taking a calculated shot. Trust is the currency in the world of investment. And nothing builds trust like transparency. The P&L statement, in its detailed glory, offers this transparency to investors and stakeholders. Every number, every metric, and every trend tells a story. To the trained eye of an investor, this story reveals the potential for growth, risks involved, and the competence of the management. Numbers tell a tale, but not the whole story. The P&L statement, for all its details, can't capture non-financial factors. Employee morale, brand reputation, or customer satisfaction don’t find a mention here. For a holistic view of a company, one needs to venture beyond the P&L. It’s a crucial document, but not an exhaustive reflection of a business's health or potential. Cash is king in business. Yet, the P&L statement doesn’t provide insights into cash flow. Revenues booked doesn’t always mean cash received. Moreover, the timing of cash inflows and outflows is critical for liquidity and operational smoothness. Businesses can be profitable on paper, but cash-strapped in reality. Analyzing revenue trends goes beyond the absolute numbers. Examining year-on-year sales growth and seasonal patterns can reveal market shifts, competition moves, or internal challenges when revenue experiences dips. Analyzing these trends offers foresight, allowing businesses to adapt, evolve, and innovate. Where is the money going? Evaluating the cost structure can unearth inefficiencies, areas of wastage, or even opportunities for negotiation and savings. A well-balanced cost structure ensures sustainability. It guarantees that growth in revenue translates to increased profitability, rather than being eaten up by escalating costs. Numbers in isolation can be misleading. Ratios offer context. Profitability ratios, derived from the P&L statement, help gauge the efficiency of operations. From gross profit margins to return on sales, these ratios paint a clear picture of financial health, allowing for comparisons across periods or even industries. When evaluating a profit and loss statement, it is important to consider statements from previous periods to get a more accurate sense of the rate of change in a company's revenues and expenses. For example, if a company's expenses are increasing faster than its revenue over several fiscal years, it could indicate a looming problem. The Profit and Loss Statement (P&L) serves as a comprehensive financial snapshot, encapsulating a company's revenue, expenses, and overall profitability over a specific period. Its primary purpose is to assess a company's ability to generate profit by increasing revenue, reducing costs, or both. Alongside the balance sheet and cash flow statement, it is one of the three core financial documents that measure company performance. The P&L statement offers invaluable insights into a business's operations, efficiency, and potential areas for growth or improvement. By analyzing revenue trends, evaluating the cost structure, and assessing profitability ratios, stakeholders can make informed decisions and chart the course for the future. Moreover, transparency in presenting the P&L statement strengthens trust and communication with investors and stakeholders. However, the P&L statement has its limitations. It doesn't capture non-financial factors critical to a company's success, and it ignores cash flow and timing, which are vital for liquidity and operational stability.Profit and Loss Statement (P&L) Definition
The Purpose of a P&L Statement
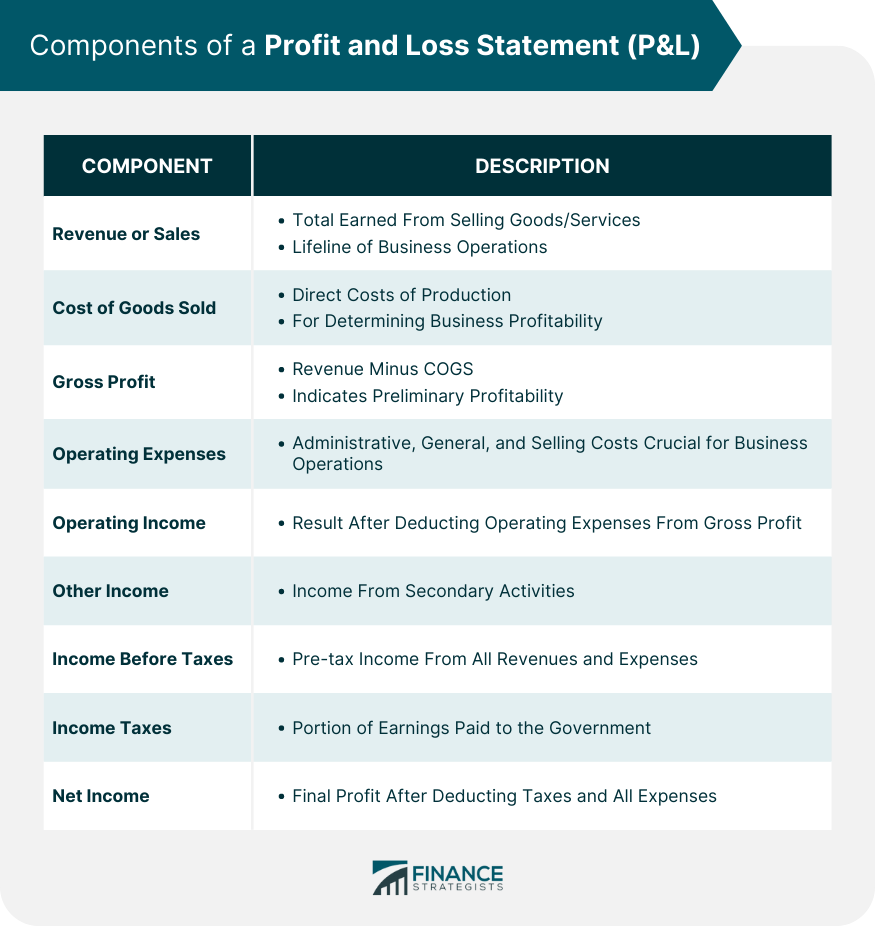
Components of a Profit and Loss Statement
Revenue or Sales
Cost of Goods Sold (COGS)
Gross Profit
Operating Expenses
Operating Income (Operating Profit)
Other Income and Expenses
Income Before Taxes (Pre-tax Income)
Income Taxes
Net Income (Net Profit)
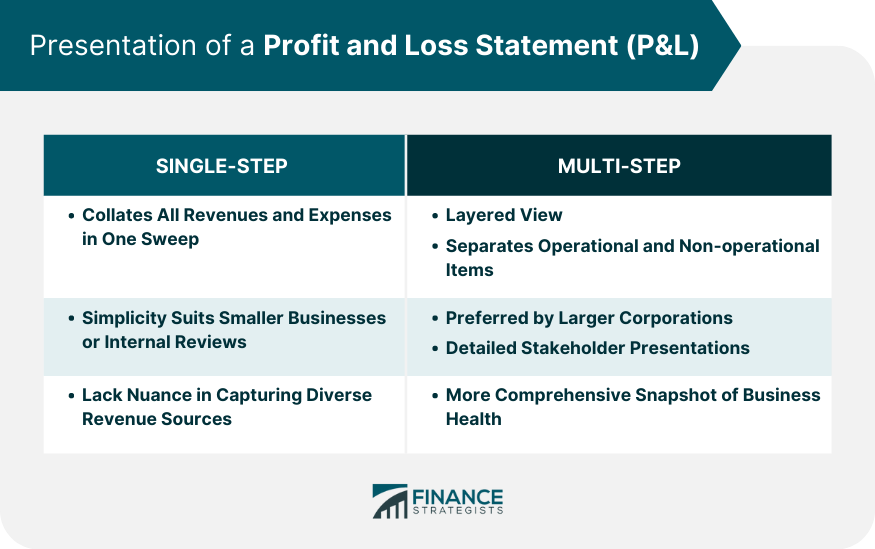
Presentation of a Profit and Loss Statement
Single-Step P&L Statement
Multi-Step P&L Statement
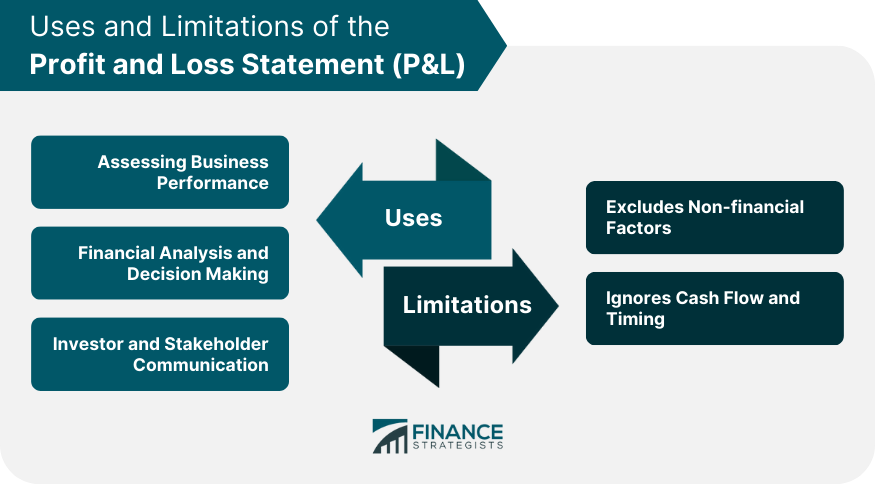
Uses of the P&L Statement
Assessing Business Performance
Financial Analysis and Decision Making
Investor and Stakeholder Communication
Limitations of the P&L Statement
Excludes Non-financial Factors
Ignores Cash Flow and Timing
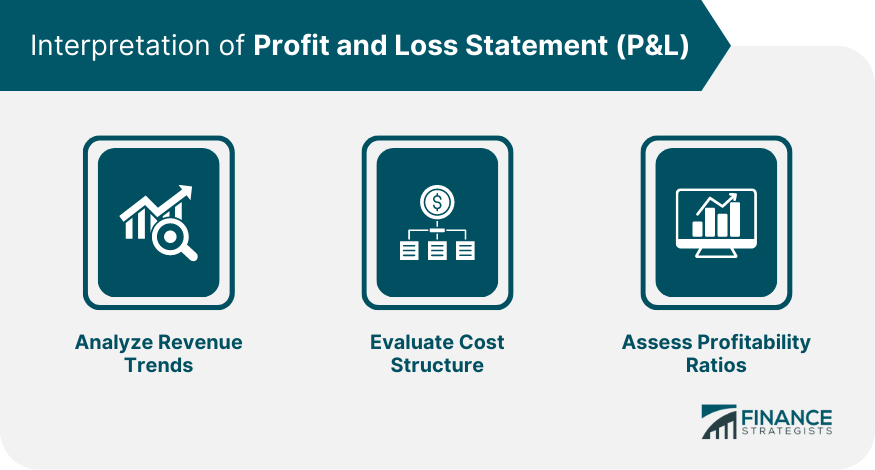
Interpretation of Profit and Loss Statement
Analyze Revenue Trends
Evaluate Cost Structure
Assess Profitability Ratios
P&L Statement Example
Conclusion
Profit and Loss Statement (P&L) FAQs
P&L refers to a profit and loss statement in accounting.
A profit and loss statement, also called an income statement or P&L statement, is a financial document that summarizes the revenues, costs, and expenses incurred by a company during a specified period.
The purpose of a P&L statement is to provide information about a company’s overall ability to generate profit, either by increasing revenue or decreasing costs, or both.
When evaluating a profit and loss statement, it is important to consider statements from previous periods to get a more accurate sense of the rate of change in a company’s revenues and expenses. For example, if a company’s expenses are increasing faster than its revenue over several fiscal years, it could indicate a looming problem.
Along with the balance sheet and statement of cash flows, the P&L is one of the three core financial documents that measure company performance.
True Tamplin is a published author, public speaker, CEO of UpDigital, and founder of Finance Strategists.
True is a Certified Educator in Personal Finance (CEPF®), author of The Handy Financial Ratios Guide, a member of the Society for Advancing Business Editing and Writing, contributes to his financial education site, Finance Strategists, and has spoken to various financial communities such as the CFA Institute, as well as university students like his Alma mater, Biola University, where he received a bachelor of science in business and data analytics.
To learn more about True, visit his personal website or view his author profiles on Amazon, Nasdaq and Forbes.


