The Treynor Ratio, also known as the reward-to-volatility ratio, is a performance measurement that evaluates the return generated by an investment portfolio relative to its systematic risk. By taking into account the risk inherent in the market, this metric offers investors a means of gauging the effectiveness of their investment decisions. Understanding the components of the Treynor Ratio is crucial to appreciating its significance in evaluating investment performance. The ratio incorporates the portfolio return, risk-free rate, and portfolio beta in its calculation. The portfolio return is the total return generated by an investment portfolio over a given period. It includes capital gains, dividends, and interest payments, and can be expressed as a percentage of the initial investment. The risk-free rate is the return on a theoretically risk-free investment, such as a government bond. This rate is used as a benchmark for comparing the performance of riskier investments. Portfolio beta is a measure of a portfolio's sensitivity to market movements, or its systematic risk. A higher beta indicates a greater degree of risk associated with market fluctuations. Systematic risk, also known as market risk, is the risk inherent in the overall market or economic system. It is unavoidable and affects all investments to varying degrees. Unsystematic risk, also known as specific risk or diversifiable risk, is the risk associated with individual investments or sectors within a portfolio. This type of risk can be reduced or eliminated through diversification. Calculating the Treynor Ratio involves applying a specific formula, understanding its interpretation, and recognizing its limitations and assumptions. The Treynor Ratio is calculated using the following formula: A higher Treynor Ratio indicates a better risk-adjusted return for the portfolio. Conversely, a lower ratio suggests that the portfolio's returns are not adequate given the level of systematic risk it has assumed. To illustrate the Treynor Ratio calculation, let's consider the following example: Portfolio Return: 12% Risk-Free Rate: 2% Portfolio Beta: 1.5 Treynor Ratio = (12% - 2%) / 1.5 = 6.67% In this example, the portfolio generated a Treynor Ratio of 6.67%, which indicates its performance relative to its exposure to systematic risk. While the Treynor Ratio provides valuable insights into a portfolio's risk-adjusted return, it has some limitations and relies on certain assumptions: The Treynor Ratio only considers systematic risk and assumes that unsystematic risk has been eliminated through diversification. This may not be true for all portfolios, especially those with concentrated investments. The ratio assumes that the risk-free rate and portfolio beta remain constant over time, which may not be the case in dynamic market conditions. The Treynor Ratio may not be appropriate for comparing portfolios with different investment objectives or risk profiles. The Treynor Ratio has numerous practical applications in the world of finance, including portfolio management, fund evaluation and selection, and risk-adjusted performance comparisons. Portfolio managers can use the Treynor Ratio to assess the risk-adjusted return of their investment portfolios and make informed decisions about asset allocation and risk management strategies. Investors can employ the Treynor Ratio to compare the performance of different investment funds, taking into account the risk associated with each fund. This can help them identify funds that offer the best risk-adjusted return for their investment goals. The Treynor Ratio can be used to compare the risk-adjusted performance of various investment portfolios, enabling investors to determine which portfolios have been the most efficient in generating returns relative to their exposure to systematic risk. The Treynor Ratio, like any financial metric, is not without its critics and controversies. Some of the most common criticisms include: The Treynor Ratio focuses solely on systematic risk and assumes that unsystematic risk has been eliminated through diversification. This can lead to misleading results when comparing non-diversified portfolios or portfolios with high levels of unsystematic risk. As mentioned earlier, the Treynor Ratio assumes that unsystematic risk has been eliminated through diversification. Consequently, the ratio may not be appropriate for comparing the performance of non-diversified portfolios or concentrated investments, as these portfolios may have a significant level of unsystematic risk that is not captured by the ratio. The Treynor Ratio's results can be sensitive to the input assumptions used in its calculation, such as the risk-free rate and portfolio beta. Changes in these inputs can have a significant impact on the calculated ratio, which may lead to different conclusions about a portfolio's risk-adjusted performance. Over the years, several enhancements to the Treynor Ratio have been developed to address its limitations and improve its applicability to different investment scenarios. These enhancements include the Modified Treynor Ratio, the Treynor-Black Model, and the incorporation of alternative risk measures. The Modified Treynor Ratio adjusts the traditional Treynor Ratio formula to account for the fact that some portfolios may have higher unsystematic risk than others. This enhancement can provide a more accurate assessment of the risk-adjusted return for non-diversified portfolios. The Treynor-Black Model is a portfolio optimization technique that combines the Treynor Ratio with the principles of modern portfolio theory. This approach allows investors to identify the optimal combination of active and passive investments to maximize risk-adjusted return. Some researchers have proposed incorporating alternative risk measures into the Treynor Ratio, such as Value-at-Risk (VaR) or Conditional Value-at-Risk (CVaR), to better capture the risk characteristics of certain investment portfolios. There are several performance metrics available to investors, each with its unique focus and approach. The Treynor Ratio can be compared and contrasted with metrics such as the Sharpe Ratio, Jensen's Alpha, and Sortino Ratio to provide a more holistic understanding of an investment's performance. The Sharpe Ratio is a similar metric that evaluates the risk-adjusted return of an investment portfolio. However, unlike the Treynor Ratio, which focuses on systematic risk, the Sharpe Ratio considers the investment's total risk, including both systematic and unsystematic risk. Jensen's Alpha is a measure of the risk-adjusted return of an investment portfolio, with a focus on the portfolio's alpha, or the excess return relative to the expected return based on the portfolio's beta. This metric provides insight into the portfolio manager's ability to generate returns beyond the market's expectations. The Sortino Ratio is another risk-adjusted performance measurement that emphasizes downside risk, or the risk of negative returns. This metric is particularly useful for investors who are more concerned about the potential for losses than the overall volatility of their investments. The Treynor Ratio is a widely used performance measure that evaluates the risk-adjusted return of an investment portfolio relative to its systematic risk. Working with a wealth management professional who understands how to interpret and apply this metric can help investors make better-informed decisions and achieve their long-term financial goals.What Is the Treynor Ratio?
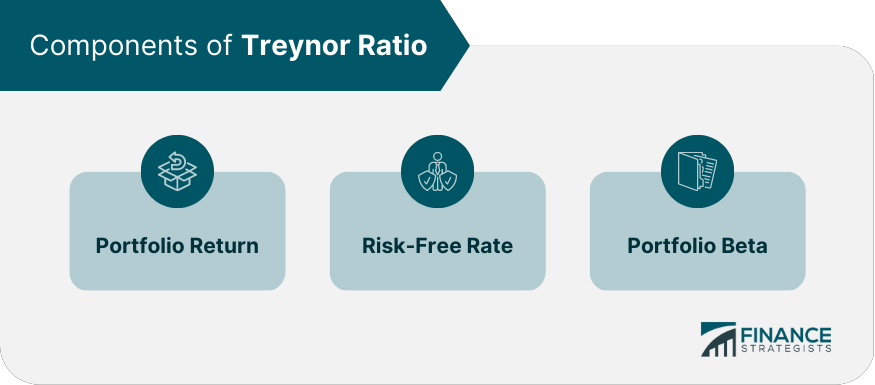
A higher Treynor Ratio indicates a better risk-adjusted performance of the portfolio. It implies that the portfolio has generated higher returns relative to its systematic risk, which is a desirable characteristic for investors. Components of the Treynor Ratio
Portfolio Return
Risk-Free Rate
Portfolio Beta
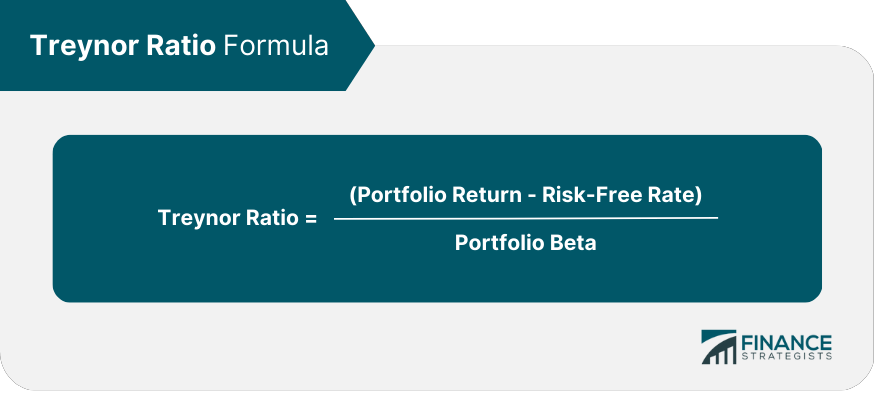
Calculating the Treynor Ratio
Formula and Interpretation
Example Calculation
Limitations and Assumptions
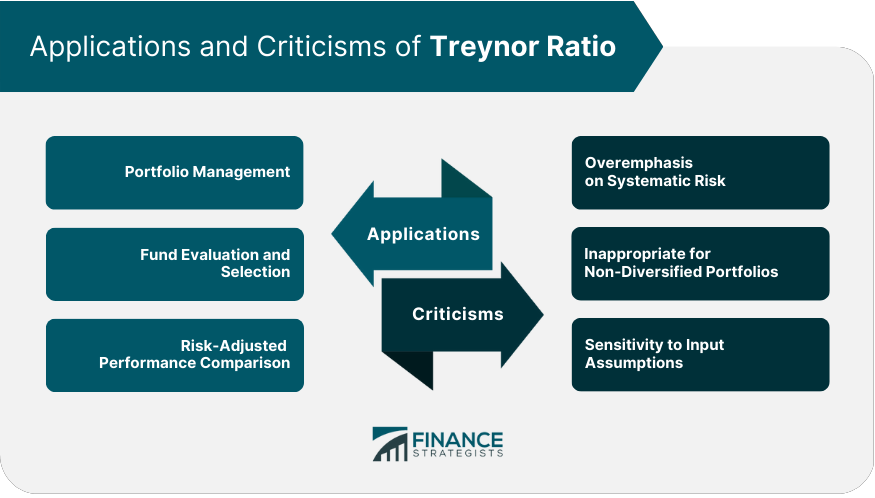
Applications of the Treynor Ratio
Portfolio Management
Fund Evaluation and Selection
Risk-Adjusted Performance Comparison
Criticisms and Controversies of the Treynor Ratio
Overemphasis on Systematic Risk
Inappropriate for Non-Diversified Portfolios
Sensitivity to Input Assumptions
Enhancements to the Treynor Ratio
Modified Treynor Ratio
Treynor-Black Model
Incorporating Alternative Risk Measures
Other Performance Metrics
Sharpe Ratio
Jensen's Alpha
Sortino Ratio
Bottom Line
It incorporates the portfolio return, risk-free rate, and portfolio beta to provide investors with insights into the effectiveness of their investment decisions.
While it has limitations and assumptions, it can be applied in various areas of finance, including portfolio management, fund evaluation, and risk-adjusted performance comparisons.
Critics have pointed out its overemphasis on systematic risk, lack of suitability for non-diversified portfolios, and sensitivity to input assumptions.
Enhancements to the Treynor Ratio have been proposed to address these limitations, including the Modified Treynor Ratio, Treynor-Black Model, and the incorporation of alternative risk measures.
Investors can also consider other performance metrics such as the Sharpe Ratio, Jensen's Alpha, and Sortino Ratio to gain a more holistic understanding of investment performance.
The Treynor Ratio plays a crucial role in investment analysis by offering a metric for evaluating the risk-adjusted return of an investment portfolio.
Treynor Ratio FAQs
The Treynor Ratio is a risk-adjusted performance metric that evaluates the return generated by an investment portfolio relative to its systematic risk.
The Treynor Ratio is calculated by dividing the portfolio's excess return over the risk-free rate by the portfolio's beta, which measures its sensitivity to market movements.
The Treynor Ratio has various applications in portfolio management, fund evaluation and selection, and risk-adjusted performance comparisons.
The Treynor Ratio has limitations, including an overemphasis on systematic risk, inappropriateness for non-diversified portfolios, and sensitivity to input assumptions.
Enhancements to the Treynor Ratio include the Modified Treynor Ratio, the Treynor-Black Model, and the incorporation of alternative risk measures like Value-at-Risk (VaR) and Conditional Value-at-Risk (CVaR).
True Tamplin is a published author, public speaker, CEO of UpDigital, and founder of Finance Strategists.
True is a Certified Educator in Personal Finance (CEPF®), author of The Handy Financial Ratios Guide, a member of the Society for Advancing Business Editing and Writing, contributes to his financial education site, Finance Strategists, and has spoken to various financial communities such as the CFA Institute, as well as university students like his Alma mater, Biola University, where he received a bachelor of science in business and data analytics.
To learn more about True, visit his personal website or view his author profiles on Amazon, Nasdaq and Forbes.