
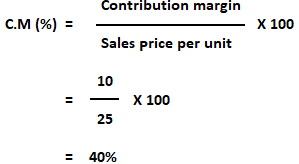
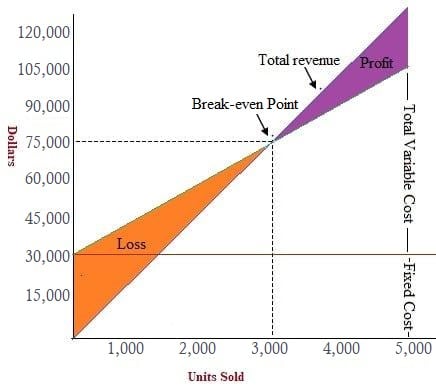
The break-even point is the volume of activity at which a company's total revenue equals the sum of all variable and fixed costs. The activity can be expressed in units or in dollar sales. The break-even point is the point at which there is no profit or loss. At the break-even point, the total cost and selling price are equal, and the firm neither gains nor losses. The income of the business exactly equals its expenditure. This point is also known as the minimum point of production when total costs are recovered. It is possible to calculate the break-even point for an entire organization or for the specific projects, initiatives, or activities that an organization undertakes. The basic objective of break-even point analysis is to ascertain the number of units of products that must be sold for the company to operate without loss. In other words, the no-profit-no-loss point is the break-even point. Sales below the break-even point mean a loss, while any sales made above the break-even point lead to profits. As you will be aware, profit can be calculated as sales revenues minus costs, where costs are either variable or fixed. That is to say, Profit = Sales revenue - Variable costs - Fixed costs where the sales revenue at break-even point = Fixed cost + Variable cost This equation can be restated as follows: Profit = (Unit sales price x Sales volume in units) - (Unit variable cost x Sales volume in units) - Fixed costs This section provides an overview of the methods that can be applied to calculate the break-even point. The following equation is helpful when finding the break-even point using the algebraic method: SP = VC + FC where With this in mind, the following equation can be used to find the break-even point (o): o = SP - VC - FC Using the algebraic method, we can also identify the break-even point in unit or dollar terms, as illustrated below. Suppose that ABC Limited manufactures and sells a single product. The different costs per unit are as follows: Required: Calculate the break-even point in units and dollars using the algebraic method. The following formula can be used to calculate the sold number of units at the break-even point: SP x Y = VC x Y + FC where Y is the number of units sold to break-even. It follows that: 25 x Y = 15 x Y + 30,000 25Y = 15Y + 30,000 25Y - 15Y = 30,000 10Y = 30,000 Y = 30,000/10 Y = 3,000 units Now, as we have calculated the break-even point in unit terms, we can easily compute the break-even point in dollars. To do this, we use the following equation: BE point in dollars = BE point in units x SP = 3,000 x 25 = $75,000 It is also possible to compute the break-even point using the contribution margin method. Let's consider the same figures for ABC Limited used in our example on the algebraic method. CM = SP - VC CM = $25 - $15 CM = $10 Use the following formula to calculate the break-even point in sales units: BE point = Fixed costs / CM per unit = 30,000 / 10 = 3,000 units Now, calculate the break-even point in dollars using the following formula: BE point (dollars) = Fixed cost / CM (expressed as a percentage of sales revenue) = 30,000 / 40%* BE point (dollars) = $75,000 * C.M in percentage Break-even point = Total fixed cost X (Sales / Contribution margin) If the same cost data are available as in the example on the algebraic method, then the contribution is the same (i.e., $16). In addition, the break-even point would be 40,000 x (20/16) = 25,000 x 20 = $50,000. The break-even point or cost-volume-profit relationship can also be examined using graphs. Break-even point analysis can be applied to answer many important questions in business, including:Break-Even Point (BEP) Definition
Break-Even Point: Explanation
Formula For Break-Even Point
Methods to Calculate Break-Even Point
1. Algebraic/Equation Method
Example
Solution
2. Contribution Margin Method (or Unit Cost Basis)
3. Budget Total Basis
4. Graphical Presentation Method (Break-Even Chart or CVP Graph)
Importance of Break-Even Point Analysis
Break-even Point FAQs
The break-even point is the volume of activity at which a company’s total revenue equals the sum of all variable and fixed costs. The activity can be expressed in units or in dollar sales. The break-even point is the point at which there is no profit or loss.
The basic objective of break-even point analysis is to ascertain the number of units of products that must be sold for the company to operate without loss. In other words, the no-profit-no-loss point is the break-even point.
Profit = sales revenue – variable costs – fixed costs
The break-even point can be affected by a number of factors, including changes in fixed and variable costs, price, and sales volume.
No, the break-even point cannot be used to predict future profits. It is only useful for determining whether a company is making a profit or not at a given point in time.
True Tamplin is a published author, public speaker, CEO of UpDigital, and founder of Finance Strategists.
True is a Certified Educator in Personal Finance (CEPF®), author of The Handy Financial Ratios Guide, a member of the Society for Advancing Business Editing and Writing, contributes to his financial education site, Finance Strategists, and has spoken to various financial communities such as the CFA Institute, as well as university students like his Alma mater, Biola University, where he received a bachelor of science in business and data analytics.
To learn more about True, visit his personal website or view his author profiles on Amazon, Nasdaq and Forbes.


